The SEO Mistake Audit Workflow: Diagnosing and Prioritizing Fixes That Actually Recover Lost Organic Revenue

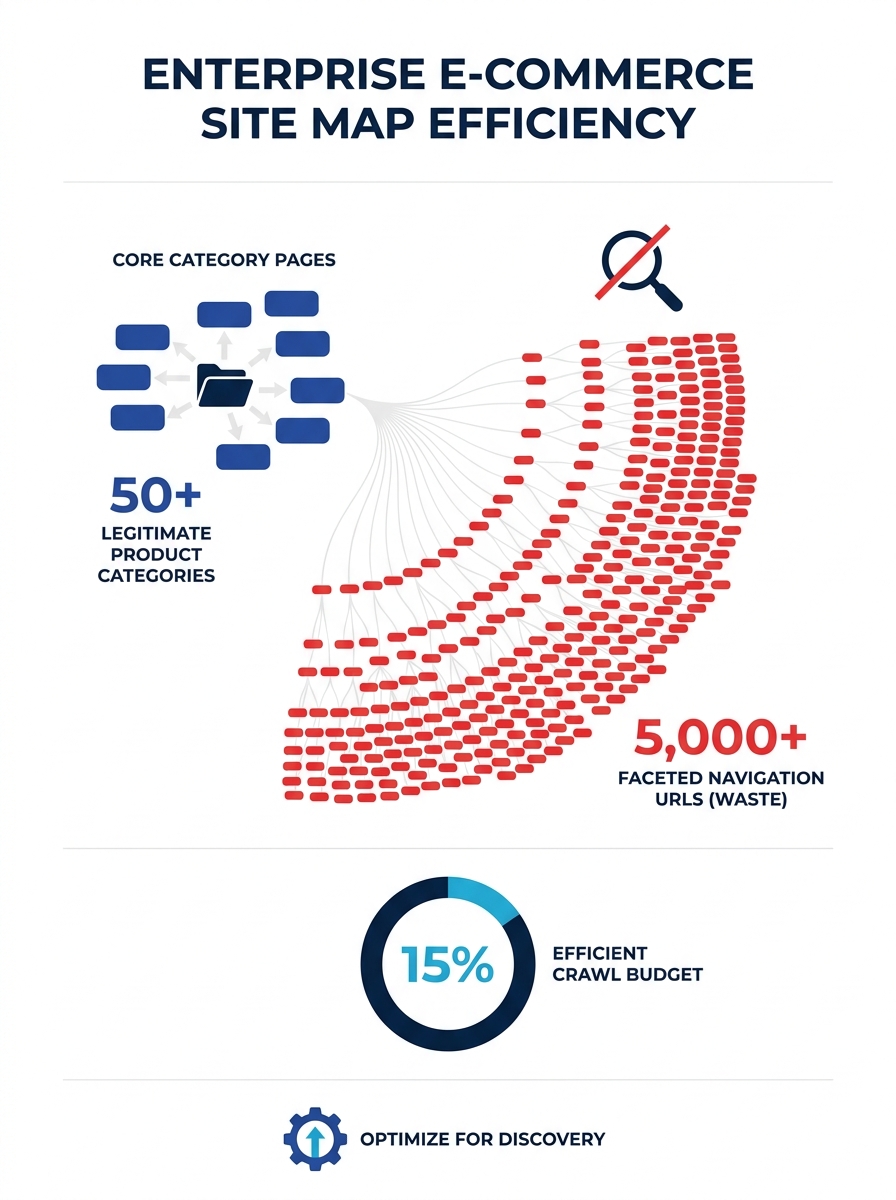
Four Dots published an enterprise technical SEO audit where faceted navigation alone had spawned 47,000 duplicate URLs consuming 34% of the site’s crawl budget, while zero of those pages generated organic revenue. The audit projected 12-18% traffic recovery within 60 days of deploying fixes. That case exposes exactly how an SEO audit prioritization framework should operate and where most audits fall apart.
The 47,000 Phantom Pages Behind a Catalog’s Decline
The site was an enterprise e-commerce catalog. Product pages numbered in the low thousands, but faceted filters for size, color, brand, price range, and sort order had multiplied the URL count by an order of magnitude. The 47,000 duplicate URLs Four Dots identified were structurally valid pages from Googlebot’s perspective. They returned 200 status codes, carried title tags, and appeared in the XML sitemap. They looked like real inventory.
But none of them ranked. None of them converted. And every time Googlebot visited the domain, it spent roughly a third of its crawl allocation on those phantom pages instead of the actual product and category URLs that drove purchases.
The site’s team had already run two prior audits using standard crawl tools. Both audits flagged “duplicate content” and “thin pages” across hundreds of rows in export files. The finding was accurate. The output was useless. As Optimist’s 2026 B2B SEO audit framework bluntly put it, a standard site-health audit “surfaces crawl errors, missing meta tags, thin pages, and broken links” but produces “a clean report that doesn’t explain why the program isn’t producing pipeline.”
That’s the core failure mode of most organic traffic recovery workflows: the diagnosis is technically correct but operationally unactionable. A 1,400-row spreadsheet of crawl errors, each tagged as “medium priority,” tells a development team nothing about sequencing. We’ve written before about how enterprise audit bottlenecks emerge when ticket volume replaces prioritization logic, and this case followed that pattern precisely.
Scoring Issues by Revenue Proximity
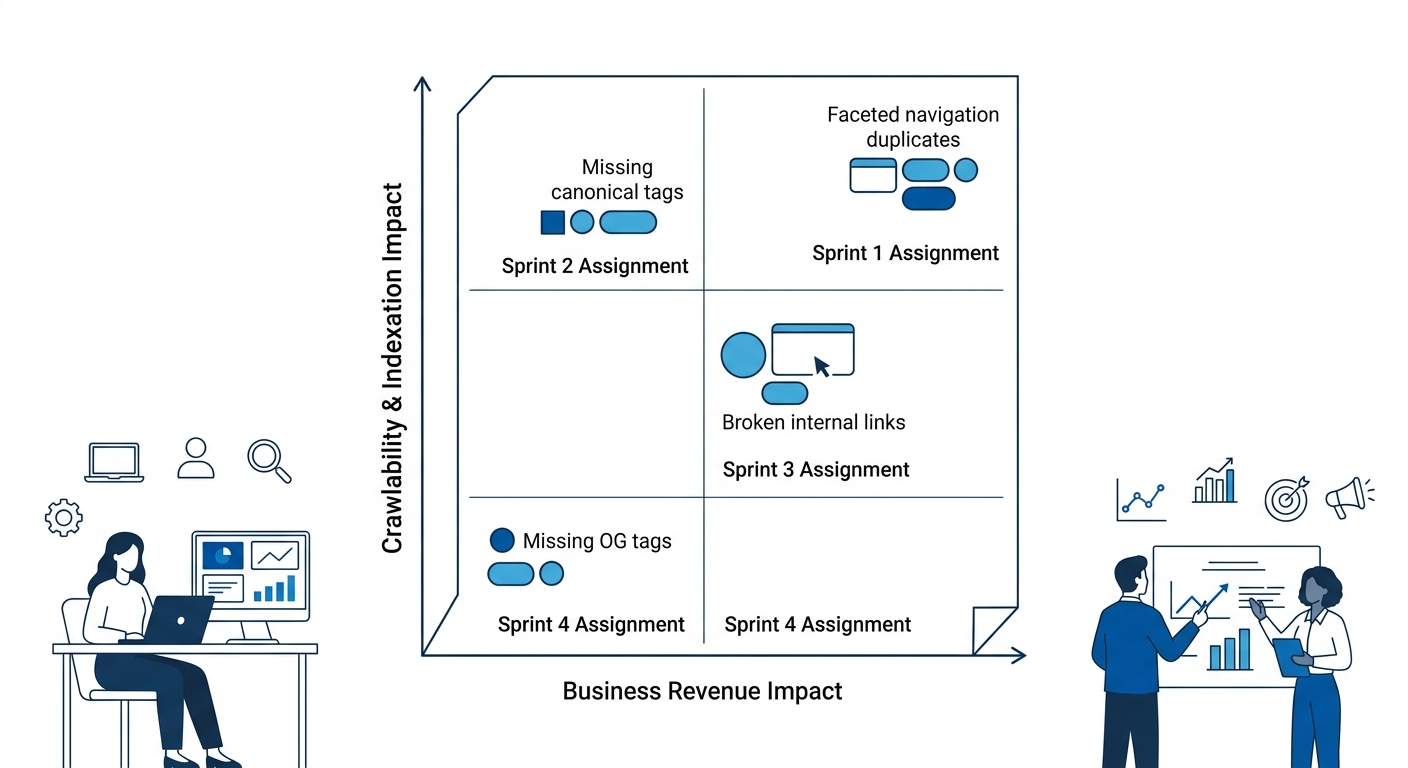
The Four Dots audit introduced a two-axis scoring system. Every identified issue received a crawlability/indexation impact score and a separate business revenue impact score. The combination determined sprint priority, and that combination is what separates a useful technical SEO troubleshooting process from a decorative PDF.
The 47,000 faceted URLs scored highest on both axes. They consumed 34% of crawl budget (high crawlability impact) and directly starved revenue-generating product pages of indexation attention (high revenue impact). That put them into Sprint 1 without debate. Contrast that with another common finding in the same audit: pages missing Open Graph tags. Technically a valid issue, and one that shows up in every audit tool’s “warnings” tab. But missing OG tags have near-zero crawlability impact and minimal revenue impact. They belong in Sprint 4 or later, if they get addressed at all.
This scoring approach aligns with what Seer Interactive recommends in their diagnostic framework for organic traffic decline: “Once you have a list of suspected causes, prioritize the ones with the strongest signal first—technical issues, lost rankings, AI Overview impact—then work through them one at a time. The key is being systematic.”
The revenue-proximity axis deserves special attention. An issue affecting a page that generates organic sessions converting to purchases scores differently than the same issue affecting a blog post with informational intent. The hidden cost of enterprise site architecture breakdowns compounds when the pages most affected sit closest to the transaction layer. In this case, product detail pages were being outcompeted for crawl attention by their own filter permutations.
Google’s own infrastructure constraints reinforce why this scoring matters. Gary Illyes confirmed in March 2026 that Googlebot enforces a 2MB crawl limit per page fetch, meaning critical meta tags and structured data must appear within the first 2 megabytes of HTML. Enterprise sites with bloated page weight risk having their canonical tags, hreflang annotations, and schema markup truncated before Googlebot even reads them. That constraint turns “page weight” from a performance optimization into a crawl-and-index problem, and it scores higher on the revenue impact axis than most teams realize.
Three Fixes in Sprint One
The audit converted its scored findings into three discrete development tickets for the first sprint. Not thirty. Not three hundred. Three.
The first ticket addressed the faceted navigation URLs directly: implement proper canonical tags on all filter permutations pointing back to the parent category page, add noindex directives to parameter-heavy URLs, and update the robots.txt to disallow crawl of sort-order and pagination-chain paths. This single ticket, once deployed, would reclaim that 34% crawl budget allocation.
The second ticket targeted broken internal links across the product catalog. Internal link analysis had identified 312 broken links pointing to discontinued products, creating dead ends in the site’s link equity flow. Teams responsible for product-page SEO often underestimate how quickly link rot accumulates when catalogs change seasonally. Each broken link is a signal to Googlebot that the site’s internal structure isn’t maintained, and Seer Interactive’s framework identifies broken internal linking as a top-5 cause of organic traffic decline.
The third ticket was a sitemap cleanup. The XML sitemap included all 47,000 faceted URLs alongside the legitimate product pages, which meant Googlebot’s sitemap-driven crawl was actively directing resources toward the pages that shouldn’t exist. Removing non-canonical URLs from the sitemap and submitting a recrawl request through Google Search Console would accelerate the de-indexation of phantom pages.
The critical detail here is what Sprint 1 excluded. Core Web Vitals optimization, image compression, render-blocking resource elimination, and structured data markup enhancements were all valid findings from the audit. None of them made Sprint 1. The team’s crawl budget prioritization work focused exclusively on the issues that scored highest on both axes of the severity matrix.
Warning: Translating audit findings into tracked development tickets with owners, deadlines, and projected SEO impact inside a project management system (Jira, Asana, or equivalent) is where most audit engagements fail. If findings stay in a PDF, recovery doesn’t happen. The Four Dots case succeeded because each sprint had three to five tickets with explicit acceptance criteria.
The Rendering Layer That Extended the Diagnosis
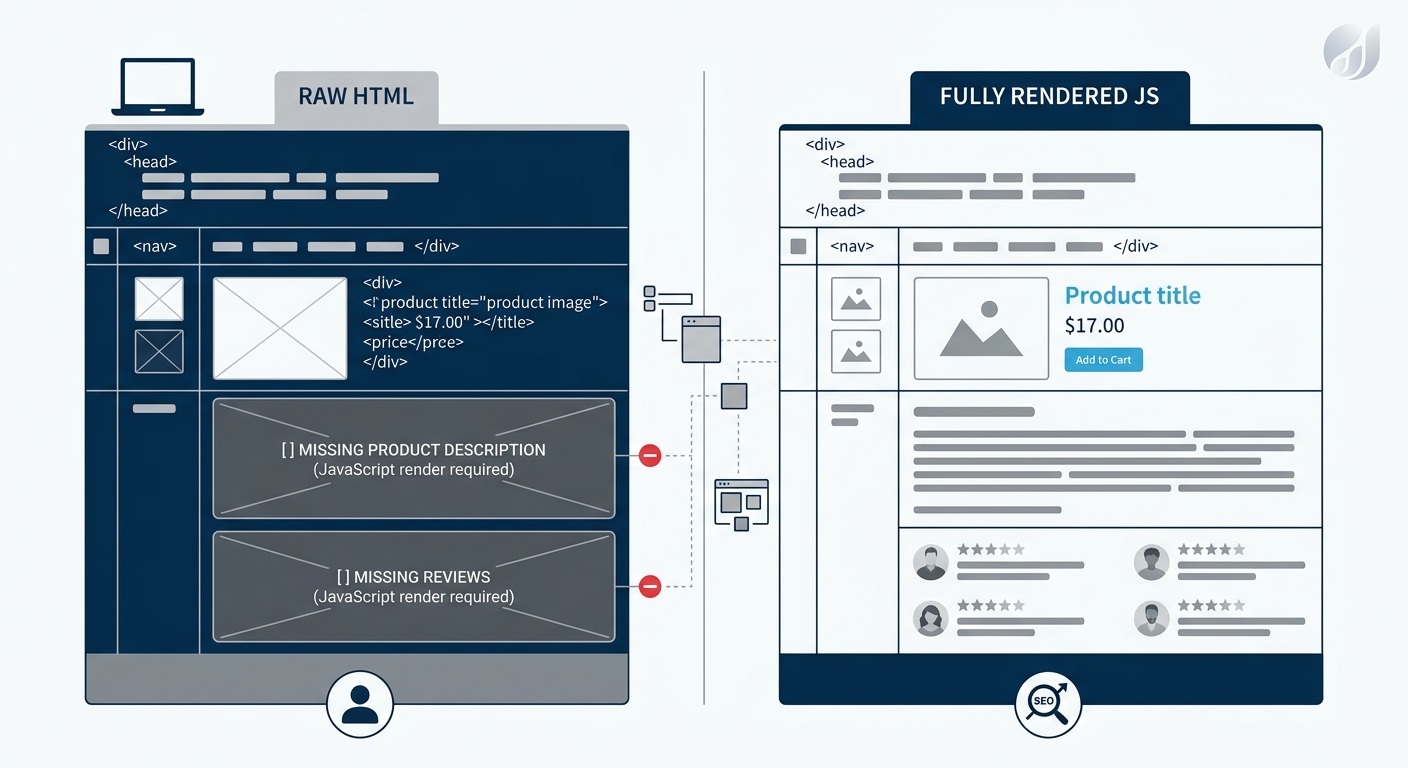
After Sprint 1 deployed, the team discovered a second problem the initial crawl-based audit hadn’t caught. A subset of product pages loaded critical content through JavaScript bundles that Googlebot’s initial crawl pass didn’t render.
Comparing raw HTML against rendered output using Google Search Console’s URL Inspection Tool revealed that 14% of product descriptions and 23% of review content existed only in the JavaScript-rendered version. Googlebot’s rendering queue processes JavaScript separately from its initial crawl pass, and pages with high render dependency face delays in full content indexation. The SEO debugging pyramid framework we’ve outlined before treats rendering discrepancies as a distinct diagnostic layer, separate from crawl-level issues, and this case showed why that separation matters.
Standard crawl tools like Screaming Frog running in “JavaScript rendering” mode caught the discrepancy once the team explicitly compared the two outputs. But the default crawl configuration, which most audits use, had missed it entirely. The team added a Sprint 2 ticket to move critical product content out of client-side JavaScript and into server-rendered HTML.
This finding carries broader implications for any enterprise site structure fixes involving JavaScript frameworks. If your agency or in-house SEO upskilling program doesn’t include rendered-vs-raw comparison as a standard audit step, the audit will miss content that Googlebot treats as nonexistent during initial indexation.
Recovery Timelines After the Faceted Navigation Cleanup
Digital Applied’s post-core-update audit template sets expectations clearly: full organic traffic recovery typically requires 2-4 months and confirmation from the next core update cycle. The Four Dots case tracked within that window. The estimated 12-18% traffic recovery within 60 days of deploying Sprint 1 fixes materialized as Googlebot reallocated its crawl budget toward revenue-generating pages that had been starved of attention.
The recovery wasn’t instant. The first two weeks showed minimal change in Search Console impressions. De-indexation of the 47,000 faceted URLs happened gradually as Googlebot recrawled them and found the new noindex directives and canonical signals. Between weeks three and six, the product category pages that had been competing with their own filter permutations began climbing in average position for their target queries. By day 60, the site’s organic sessions from product pages showed measurable improvement against the pre-audit baseline.
Sprint 2’s JavaScript rendering fixes extended the recovery curve. Pages where product content had been trapped in client-side rendering started appearing in search results for long-tail product queries they’d never ranked for before, because Googlebot was now seeing that content during its initial indexation pass rather than waiting for a delayed render queue.
The audit projected 12-18% traffic recovery within 60 days. The projection held because fixes were scored by revenue proximity, not by the loudest warning label in the crawl tool.
The cadence matters as much as the diagnosis. Agencies running audits as one-time deliverables miss the compound effect of sequential sprints. The Four Dots case ran four sprints over 90 days, with each sprint addressing the next tier of scored issues. Sprint 3 tackled Core Web Vitals, specifically LCP optimization on product pages that had improved in rankings but still lost users to slow loads. Sprint 4 addressed structured data gaps and internal linking refinements. This staged approach mirrors the diagnostic methodology for organic visibility collapse that works across enterprise sites regardless of CMS or vertical.
The difference between an audit that recovers revenue and one that sits in a shared drive folder is whether the output includes scored sprint tickets or unsorted findings. Every technical SEO troubleshooting process eventually surfaces similar categories of issues. The workflow that recovers organic traffic treats those categories as a sequenced investment decision, deploying development resources where the crawl-budget and revenue-impact scores intersect highest, and measuring recovery against the specific pages those fixes were designed to unblock.