Diagnostic Framework Published September 4 Identifies Four Causes of Rising Customer Acquisition Costs That Require Opposite Fixes

Rising customer acquisition costs that appear identical on marketing dashboards can stem from four distinct causes requiring opposite responses, according to a diagnostic framework published September 4 on Trending Media Buzz. The framework argues that degraded tracking, audience saturation, creative fatigue, and shifted channel mix produce identical CAC increases but call for different interventions—and that cutting spend before diagnosing the cause is the most common expensive mistake.
TL;DR: A September 4 framework identifies four distinct causes of rising CAC (degraded tracking, audience saturation, creative fatigue, channel mix shift) that look identical on dashboards but require opposite fixes, urging marketing leaders to check measurement integrity before diagnosing business-level issues.
Check Measurement Before Diagnosing Business Issues
The framework positions measurement degradation as the first diagnostic step, according to the published material. Measured CAC is a ratio between known spend and partially observed conversions; when observation degrades through falling consent rates, duplicated purchase events, checkout changes that drop parameters, or quietly edited UTM conventions, reported CAC worsens while actual business performance remains unchanged.
The diagnostic requires comparing total orders and revenue in the commerce platform against the same window in prior quarters, then comparing that trend with ad platform reports. If store-level orders remain steady while platform-reported conversions fall, the problem is measurement infrastructure rather than market dynamics, and reducing spend would worsen rather than solve the underlying issue.
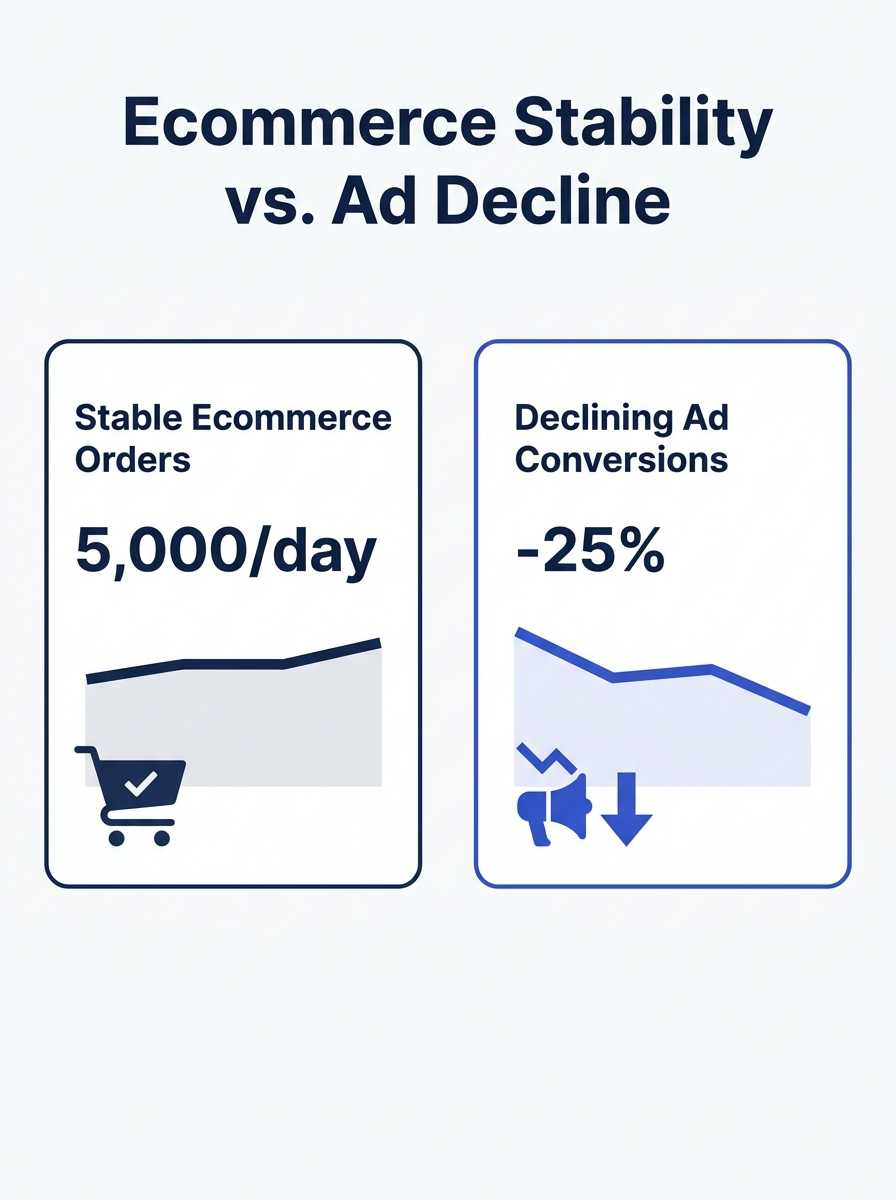
Marketing leaders managing Google Ads management or media buying services across multiple platforms face this diagnostic challenge when iOS consent rates shift, server-side tagging implementations carry gaps, or checkout flows change without coordination with analytics teams.
Four Causes That Demand Different Responses
Once measurement integrity is confirmed, the framework identifies four distinct causes in a specific diagnostic sequence. Audience saturation appears as climbing frequency and flattening reach at current budget levels—spending more to reach the same users. Creative fatigue sits at the ad level, where top-performing creative assets have run for weeks with no new material in the rotation.
Channel mix shift is described as the “quiet one” in the framework: total CAC rises while every individual channel holds steady, because budget moved toward a more expensive channel or prospecting grew as a share of total spend. Genuinely more expensive auctions are positioned as the last explanation rather than the first assumption.
The framework notes that each cause requires a different response. Saturation needs new audience segments or a new offer. Fatigue needs creative production capacity. Mix needs a budget allocation decision. Auction pressure needs a conversation about customer lifetime value and acceptable payback windows—topics that sit with finance rather than conversion rate optimization specialists alone.
Payback Period Replaces CAC as the Decision Metric
The framework argues that CAC alone cannot determine whether continued spending is justified, because it carries no time dimension and no margin calculation. Two brands with identical CAC can occupy very different positions: one sells a thin-margin item rarely reordered, the other a product with substantial contribution margin and reliable repeat purchase behavior.
CAC payback period—how long a new customer’s contribution margin takes to cover acquisition cost—becomes the governing metric. A brand financing growth from operating cash flow needs a short payback window; one with capital backing can accept a longer window and outbid rivals constrained by shorter funding horizons.
The published framework includes a case study from an unnamed women’s fashion brand showing 99 percent sales growth while new customer cost per acquisition fell 21 percent, new-customer return on ad spend rose 58 percent, and marketing efficiency ratio declined 6.7 percent. Net profit rose 136 percent and net margin improved 119 percent to approximately 3 percent.
The framework positions the decision as: at this acquisition cost, does the payback window still clear the threshold the business can fund? If yes, maintain spending while fixing the root cause in parallel. If no, reduce to the level where payback clears the threshold.
Why This Matters Now
Marketing leaders evaluating PPC management services or briefing agencies on paid media performance face a recurring challenge: CAC movement that triggers executive concern before the cause is understood. The diagnostic sequence matters because mistaken attribution—treating audience saturation as a creative problem, or measurement degradation as market saturation—wastes budget fixing the wrong layer of the system.
The shift from CAC to payback period as the governing metric aligns paid media decisions with finance rather than platform-specific efficiency targets. Enterprise marketing leaders managing multi-channel budgets need this framing to set realistic expectations with CFOs and avoid the cycle of spend cuts that solve short-term efficiency at the cost of long-term growth capacity. The framework provides the structure to brief agencies with better problem definition and evaluate whether proposed fixes address the actual cause rather than the visible symptom.