Truelogic Episode 74 Recap: Transitioning To Google Analytics 4 Part 1
On July 1, 2023, Universal Analytics ceased recording website data, and Google Analytics 4 (GA4) became the sole method for tracking new data through your Google Analytics account. GA4 is not a mere redesign of Universal Analytics, it’s a brand-new product. While it offers a lot of the same functionality, it’s also doing things quite a bit differently — from its interface and available metrics to how it quantifies the data collected. Get ready to learn as we dive into the world of Google Analytics 4.
Podcast Transcription:
Berns San Juan: Welcome to a special episode of the Truelogic DX podcast. But this time, it’s sort of like a Truelogic DX podcast/webinar. My name is Bernard, and today we’re going to be discussing a topic where we got a lot of requests. And, you know, as you can see from the screen, we’re going to be talking about Google Analytics, specifically transitioning you, your business, and your team into Google Analytics 4.
The three most popular topics that seem to have come up have been where’s my data? Why do we set it up in Tag Manager versus just the normal setup that Universal Analytics used to provide? And then for the more basic users of analytics, what does all this data mean?
So to make it easier and more accessible, we’re going to break this apart so that it can follow a podcast format, a YouTube format, and whatnot. We’re going to break it apart into three sections.
Why did Google move to Google Analytics 4?
So let’s begin with part one. So let’s talk about Google, where’s my data? GA4, part one. This is analytics, GA3, or what we call Universal Analytics, and this is Google Analytics 4, the new analytics. The question that I most frequently get whenever I discuss this with new clients is, why did Google even bother to move into Google Analytics 4? Are they just doing it to confuse everybody? And like most of you guys, and I can say maybe nine, 10 years ago, when Google retired Classic Analytics and moved to Universal, I was in your shoes where I’m thinking like, no, I’m already so used to this, but it was a good transition.
Before you knew it, I was comfortable in Universal Analytics to the point where today, if Google reverts to Classic, I might not even know how to navigate Classic Analytics just because I’m so used to Universal Analytics. GA4 does take some getting used to, but I think the most important thing to know is how to do basic navigation to find the data that you’re used to. GA4 is very friendly, but it’s only friendly if you can find what you’re looking for. So let’s take a look at the most important pieces of data that Google shows you in UA that it continues to show you inside GA4.
Where’s my Data?

Whenever you go into analytics, there are a couple of basic questions I think that you ought to be answering. You need to know why you’re there, right? And you’re probably not there because “Oh, I’m bored, let me navigate analytics.” That’s probably not why you’re there. And so the questions for you ought to be, or at least for me, when I’m in analytics, what I’m trying to take a look at is channel performance.
- How is the overall performance of my brand online?
- Which is my hardest-working channel?
- Which channel, the marketing channel, requires my attention?
- Which of my pages worked the hardest?
- For conversions, which marketing efforts drove me the most conversions?
- Which services or products drove me the best results?
These are sort of the questions that I have for myself. And so when I go to GA4 or Universal, I usually go in there with an agenda, and it’s usually to answer one of these things.
Overall Performance
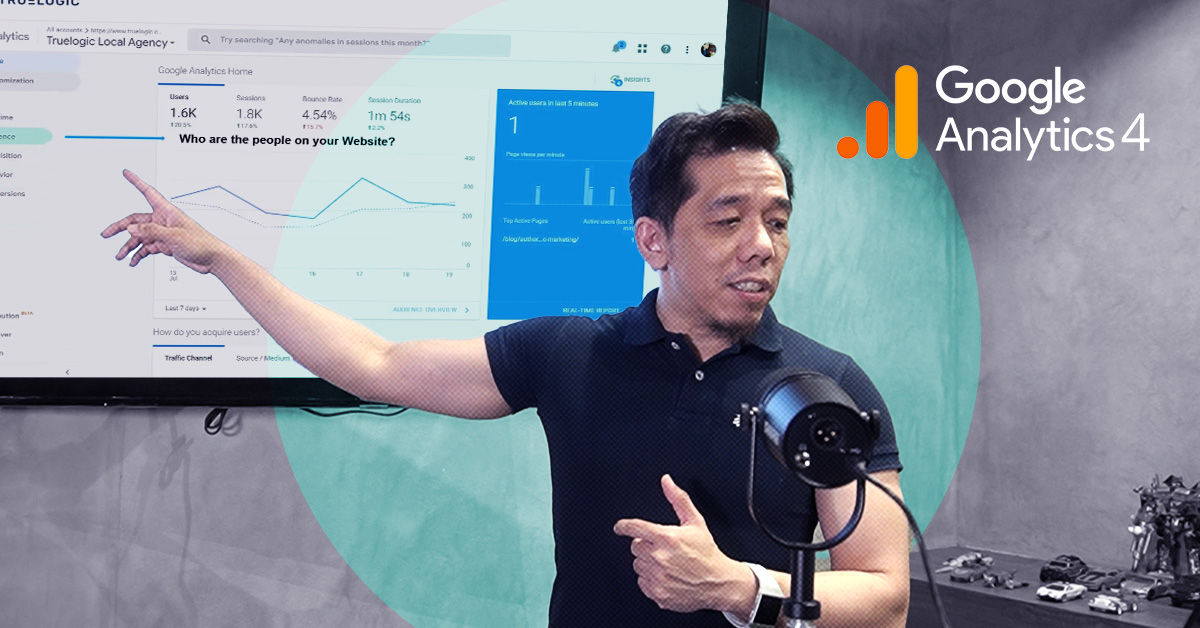
Now, we’re going to isolate the first portion of the conversation to overall performance first. So let’s talk about overall performance. This is the screen in Universal Analytics. So for most of you guys who have been doing analytics, SEO services, SEM, and marketing, this would be the screen that you’re used to. This is the home screen for Universal Analytics or GA3. And what you’ll notice is there are a lot of reports that are immediately available to you. You’ve got real-time, audience, acquisition, behavior, and conversions. This is the screen in GA4 and at first glance, people go.
Just to give you an emphasis on the difference between the two, the home screen for UA, and the home screen for GA4. And so most people get intimidated by the difference. In reality, to acquire the different reports that you’re used to seeing on the left-hand screen inside Analytics, all you have to do is click Reports. But before we jump into that, the most important piece of data that you ought to be looking at when it comes to Analytics is, who are the people your audience reports. Who are the people on your website? How did they get there, which is the acquisition data inside your Analytics? What content did they consume or what did they do? How did they behave on your website? And then the last bit is what meaningful action did they take? In summary, who they are, what they looked at, who they are, where they came from, what they looked at, and what meaningful action they take.
GA4 gives you these important pieces of information as well. So you also get these meaningful pieces of information inside GA4. So to find this inside Google Analytics 4, you just have to click the nav, and then you have to click on Reports. Just click on Reports. And once you click on Reports, set the date range you want to look at. You might be looking at month-to-date. You want to take a look at, how is my performance from the start of the month to current. You might want to take a look at, what was my overall performance in, my last full 30 days. So last month’s full performance. Or you might want to compare last month’s full performance versus the performance previous year or month-on-month.
But select the date range. And once you select the date range, the reports tab appears, right? And this is where you guys get to see the reports. What you’ll notice is it begins with acquisition, engagement, monetization, users, user attributes, and tech. And so you’re going like, okay, wait, what happened to my data? And the answer is it’s there. It just so happens that now the audience is users, right? So this is who they are. This is where they’re from. This is what they looked at, what content they consumed. So this used to be your behavior tab and monetization is your conversions, right? So GA3 just used to call users acquisitions, or sorry, users as audiences, acquisitions as acquisitions. engagement was behavior and monetization was conversion. But in reality, they’re the same thing. Let’s put them side by side. And what you’re looking at is who they are, how they got here, how they got there, what they looked at. Engagement. What meaningful action did they take? Monetization or conversions, right? So precisely the same thing.
And then, some of you might say, aha, but it’s not precisely the same thing because, in Universal, I had all of these, right? Now, where did this go? And the first thing I think we all need to do to put our feet on the ground and to, you know, to be a bit more grounded in this conversation is, how many of you use these reports? How many of you looked at demographics, interest, geo, behavior, and technology, and then made actionable marketing plans that were based on the data that you used here?
And the answer is 99% of you did not. 99% of you did not. And so what Google did, and in answer to why did Google switch from UA to GA4 is A, so that your web data and your app data can now sit in the same place. That’s one of the primary reasons, right? So that you didn’t have to go to your web plus apps and your analytics to find or tell a complete story about what your customer journey looked like. So that’s one reason.
But the other reason is this is a more streamlined view of the essentials of the data that you need to look at inside analytics. So where do all of these reports sit? Take, for example, audience, Google discovered were the ones that users most interacted with, and clicked at the most, were overview, audiences, and demographics. These seem to be the reports that got most people to click on them, that people converted into actionable marketing activities, and so on. These still exist inside GA4, right? Except this time, so remember, the audience is now users, right? So the audience is now users. It’s the same. It’s who they are. But in universal analytics, it used to be called audiences. In GA4, it’s called users.
Audience Report
If you’re looking for an audience report, that audience report will be in your user report. So it’s still there. It’s just that it is now under the User Attributes menu. And if you click it, Overview, Audiences, Demographics. The same report. So this report is still there, it’s just found in a different place. So if in UA, you found it by default on the left by clicking the arrow down on the audience, and then you saw overview audience demographics, now you have to click on reports, users, and user attributes, and then you have access to the reports. But the bottom line is they’re still there, and these are the most actionable pieces of data that you have inside your analytics, whether it’s UA or whether it’s GA4.
Acquisition Report
What if I wanted to see my acquisition reports? Okay, so I don’t want to be in audiences, but now I can’t find my all traffic data. I cannot find the source medium or where my users came from, or I want to find out which channels they come from, and so on. But let’s take the source medium report as an example. So remember in Universal, it was called acquisition. And in GA4, it is still called acquisition. So remember who they are is the audience in Universal, it is users inside GA4. The acquisition is still acquisition.
To pull up your acquisition reports, though, if you click on Reports and then click on Acquisition, you will get to a view that looks like this. Or for those of you guys that are looking at the full screen, you’re going to see a report that looks like this. And now what you’re looking at is, “Oh, they don’t look the same. How do I pull up the source medium report that I’m used to looking at? How do I find out which one is my most effective channel?” And what you do to find that report is you click on this plus sign over here. You click on this. If you click it, this menu appears. And you’ll notice that the source medium report is inside.
So now what you do is you go to acquisition, traffic acquisition, click the plus sign, select the source medium report, and then you’ve got the source medium. I guess just to give everybody a preamble, moving forward, all the screens that we’re going to be looking at are going to be exclusively GA4. So remember the initial screens we looked at earlier, what I was trying to show you is, how do I find the stuff in Universal Analytics that I’m so used to looking at. And then where do I find them in GA4?
Now that we’ve shown you where your most essential reports are in the Reports tab, in the Acquisitions tab, and inside the Engagement tab and whatnot, and where to find your reports, like your source medium reports, we’re going to dive in into a couple more things that you’re probably used to looking at inside your UA, but need to find it in analytics. There is one big crucial difference when it comes to reports inside analytics which is regarding traffic data.
Traffic Data
Now, to understand most of what you used to look at, like when you looked at UA and you looked at traffic data, one of the metrics that most brands used to look at was, how many new users versus repeat users did I have coming to my website? That used to be what everybody used to look at. And so we used to look at our session data, we used to look at our user data, and so on. A big caveat here is the difference between how GA4 and UA interpret the user report. So I’ll dive in a bit, but to understand this, let me disambiguate or define terms fairly quickly.
So a user is technically every single person, device, and browser that goes to your website. That’s what a user is. A session is the whole browsing experience that that user will go through in that one visit. So if I went to the IKEA website, I went to the homepage, I searched, I saw categories, and I looked at eight products. My visit from the homepage to my exit, or let’s say a purchase, it’s one session. It doesn’t matter whether that is comprised of 7-page views or 12-page views. All of those comprise one session. My entire browsing experience is one session. Therefore, one user can have multiple sessions. One user can have multiple sessions. If you guys go to Lazada, you’re probably one of those users that generate multiple sessions.
What are page views? Like the way I explained earlier, it is the experience you have with every page, right? So that’s what a page view is. For you to consummate your web experience or to satisfy what motivated your search, you go through navigational pages, informational pages, commercial pages, and transactional pages. Each of those pages generates a piece of data called a page view. An event is an interaction that you had with the page. You scrolled down, you lingered on a piece of content, you downloaded a PDF, you browsed the catalog. All of these are events. And conversions are essentially meaningful actions. You gave the brand, you sent the brand an email, you sent a contact form, you made a purchase, and so on. And so you booked for a webinar, right? Like all of these are essentially meaningful actions and that is conversion.
Now, notwithstanding that definition, the most important thing that you need to remember though, is when you go to the acquisition report, not the user report, but when you’re generating the acquisition report, users are where you get the data. Users are where you get the data for all users, like when you want to see how many new versus repeat visitors you had on the website. Under the acquisition report, the user acquisition report is isolated to only new users. I’ll repeat that. The user acquisition report is isolated only to new users. You might go into this page and say, Oh wait, where are my repeat visitors? I’m used to seeing my repeat visitors. They will not be in the user acquisition report. The user acquisition report only shows you new users and first-time visitors. So it’s very important to remember that as a caveat.
Now, if you want to find your all traffic data, then what you have to do is go to the Acquisition and the Traffic Acquisition tab. So you click this. When you click that, this is where you will get the report that shows you all the users. This is not isolated only to new users. However the user acquisition data is new users, and the traffic acquisition data is all users.
So with that, I’m going to end part one. I will see you in the next episode for part two, where we’re going to talk about what my data means. And then for part three, we’re going to talk about, how we set it up. Thank you very much for joining us on this episode of the Truelogic DX webinar/podcast. I’ll see you at the next one. Truelogic DX is available on Spotify, Google, and Apple accounts.