Data Analytics vs Big Data: Key Differences
Big data is the raw material. Data analytics is the process that turns it into decisions. Big data analytics is where the two converge inside a single infrastructure. The confusion between these three concepts costs organizations months of misaligned investment because each one demands different tools, different team structures, and different budget commitments.
TL;DR: Big data describes the massive, unstructured datasets your organization collects. Data analytics is the discipline of extracting patterns from those datasets. Big data analytics combines both into one stack. Knowing which you actually need prevents you from buying infrastructure you can’t use or hiring analysts who don’t have the right inputs.
| Big Data | Data Analytics | Big Data Analytics | |
|---|---|---|---|
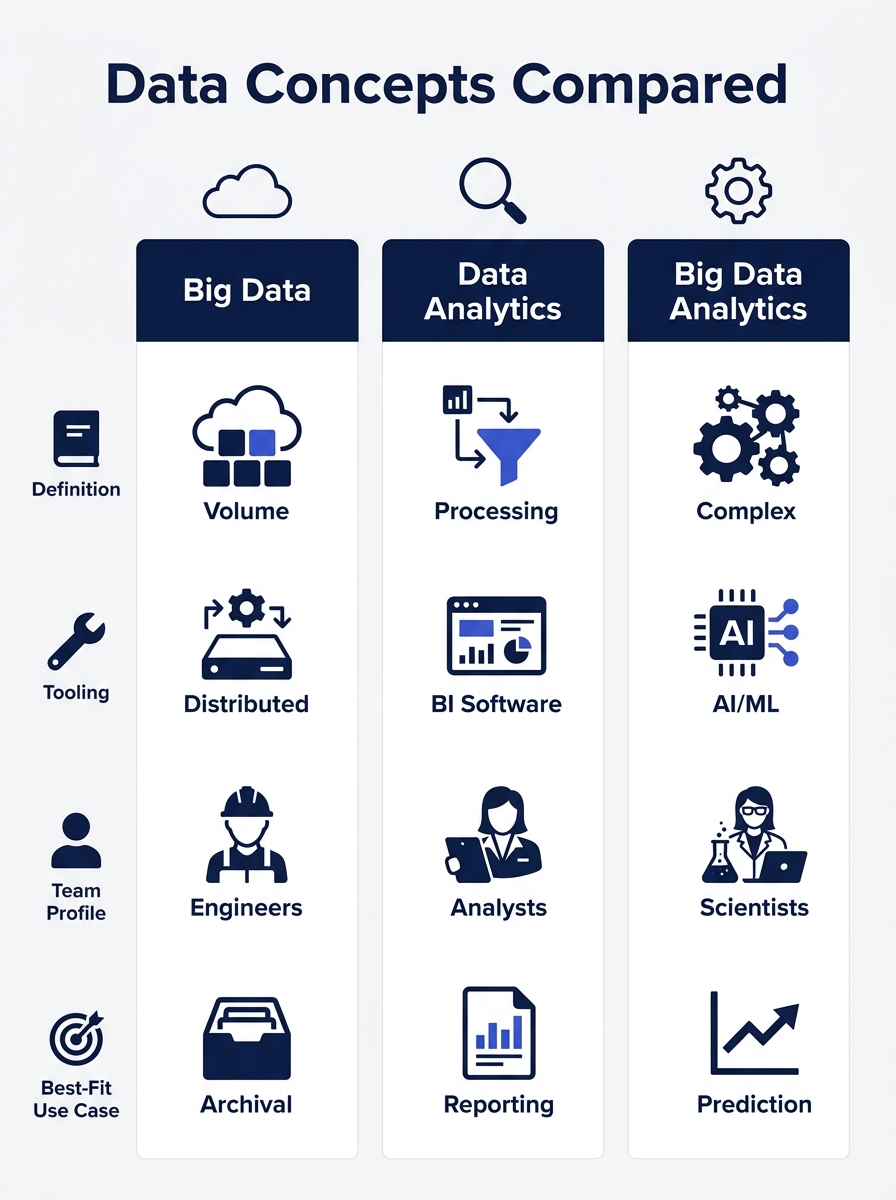
| What it is | The asset (raw datasets) | The process (pattern extraction) | The combined stack |
| Defined by | 5 V’s: Volume, Velocity, Variety, Veracity, Value | 4 types: Descriptive, Diagnostic, Predictive, Prescriptive | Lakehouse or cloud-native architecture |
| Core tooling | Data lakes, Hadoop, Spark, stream engines | BI dashboards, SQL, statistical models | Databricks, Microsoft Fabric, unified platforms |
| Team profile | Data engineers, infrastructure ops | Analysts, data scientists | Cross-functional (engineering + analytics) |
| Primary risk | Storage and ingestion costs with no insight output | Insights limited by data quality and scale | Higher complexity, longer implementation timeline |
| Best for | Organizations generating terabytes daily | Teams with structured data needing faster decisions | Enterprises needing real-time intelligence at scale |
Big Data: The Asset You Store Before You Understand
Big data refers to any large and complex collection of data, according to BMC’s technical breakdown. The University of Michigan’s Ross School of Business defines it as “the huge amounts of data that contain huge volume, variety, and velocity collected by large businesses and other organizations.” That definition has held steady for over a decade.
The standard framework for classifying big data uses five characteristics known as the 5 V’s: volume, velocity, variety, veracity, and value. Volume refers to sheer scale. Velocity refers to the speed at which data arrives. Variety captures the range of formats, from structured database rows to unstructured video files, sensor feeds, and social posts. Veracity measures trustworthiness. Value determines whether the data actually serves a business purpose.
To put volume in perspective, Coforge’s analysis notes that 900 million photos are uploaded to Facebook every single day. That’s one platform, one data type. When you add transaction logs, CRM records, IoT sensor streams, web analytics pings, and customer service transcripts across an enterprise, the volume becomes difficult to process using traditional databases.
The processing pipeline for big data follows three stages: data ingestion into a data lake or stream processing engine, data cleansing and transformation, and data loading into analytics storage optimized for querying and reporting, as SciSoft’s 2026 processing guide outlines.
Here’s the tradeoff for marketing leaders: investing in big data infrastructure means you’re building capacity to collect, store, and manage datasets at scale. But storage without analysis is an expense line, not a capability. If your team doesn’t have the analytics layer to interrogate that data, you’re accumulating cost. This is where many organizations stall. They build a data lake that becomes a data swamp because nobody standardized the ingestion formats or defined what questions the data should answer.
Warning: Big data infrastructure without a clear analytics use case leads to rising storage costs and no measurable business impact. Define the business question before you architect the data pipeline.
Data Analytics: The Process That Extracts Patterns
Why do organizations confuse data analytics with big data? Because analytics feels like the natural outcome of having data. But data analytics is a distinct discipline with its own methods, tools, and team requirements. Investopedia defines it as the process where “techniques and processes have been automated into mechanical processes and algorithms that work over raw data for human consumption.”
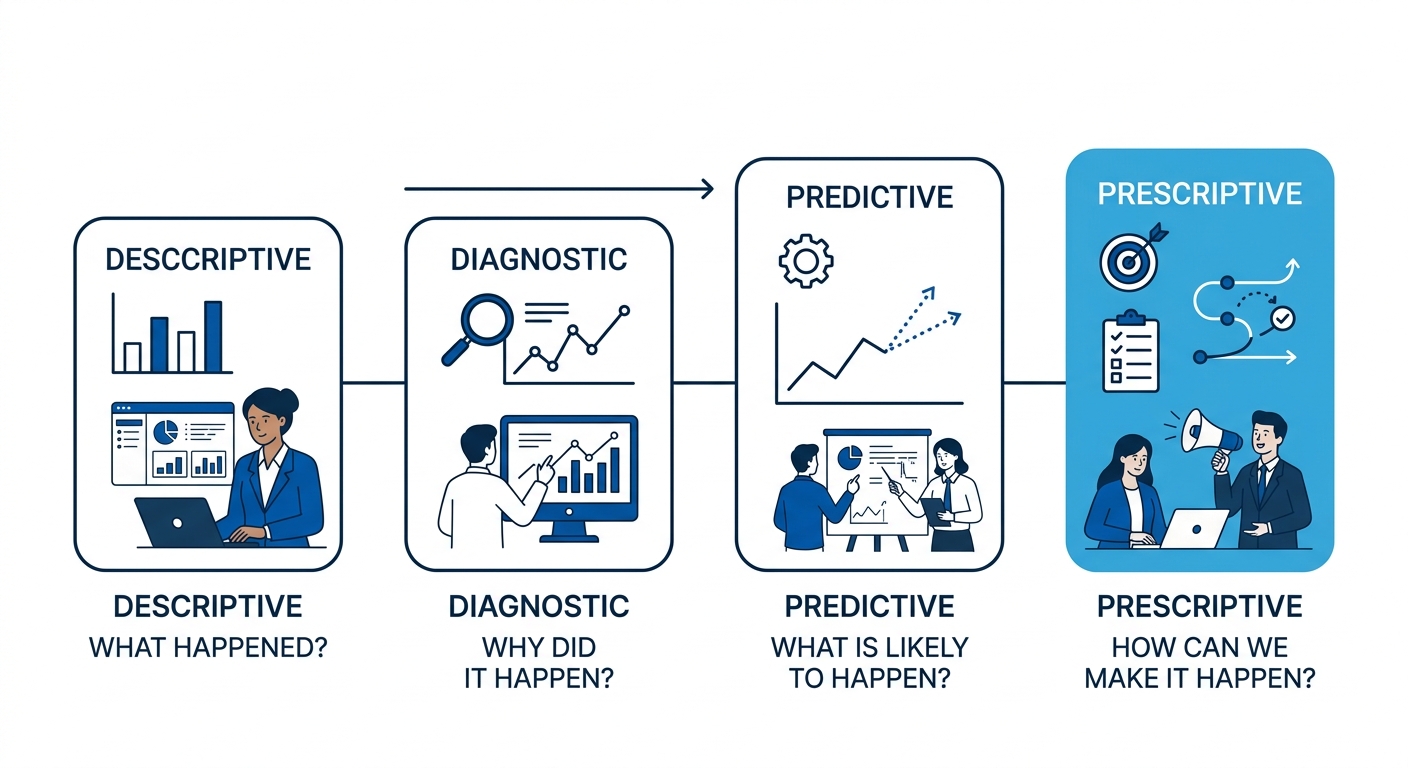
Data analytics operates across four recognized types. Descriptive analytics answers “what happened” by summarizing historical data. Diagnostic analytics answers “why it happened” by identifying root causes. Predictive analytics answers “what will happen” using statistical models and machine learning. Prescriptive analytics answers “what to do about it” by recommending actions.
The business applications are specific: sales forecasting, demand and business planning, and risk management, according to Databricks’ analytics guide. Real-time analytics enables instant decisions in finance and logistics based on live data streams. Self-service analytics tools now let non-technical users run basic analyses without waiting for a data team, which has shifted how marketing departments interact with performance data.
The tradeoff: analytics doesn’t require big data. A mid-size Philippine brand running GA4, a CRM, and monthly campaign reports has structured data that’s perfectly suited for descriptive and diagnostic analytics. You don’t need a Hadoop cluster for that. If your total dataset fits in a well-organized SQL database, traditional analytics tools will serve you well, and your measurement framework can still operate effectively at that scale.
Where analytics falls short is when the data itself outgrows the tools. When you’re pulling from 15 different data sources, each in a different format, with new records arriving every second, standard BI dashboards start breaking. The data pre-processing burden alone becomes a bottleneck. As 365 Data Science illustrates, raw data often contains entries like a person registered as “932 years old” or “United Kingdom” listed as someone’s name. Cleaning that data before analysis is where most of the time goes.
For brands working with agencies, the analytics conversation usually centers on what you need to see, how often, and how granular. That’s a process question, and it shapes everything from your SEO monitoring stack to your paid media reporting cadence.
Big data is a noun. Data analytics is a verb. Confusing the two leads organizations to buy infrastructure when they need process, or hire analysts when they need engineers.
Big Data Analytics: Where the Two Converge
Big data analytics is the analytics performed on large data sets, as the University of Michigan’s Ross School of Business describes it. This sounds obvious, but the operational reality is complex. It means building a unified architecture that handles ingestion, storage, transformation, and querying at scale while also supporting the analytical layer that produces insights.
The current industry direction points toward lakehouse architectures and cloud-native platforms. Databricks and Microsoft Fabric are two of the most widely adopted solutions for enterprises that need both the storage flexibility of a data lake and the query performance of a data warehouse. The shift from batch processing to continuous intelligence means organizations can trigger automated responses in seconds rather than waiting for overnight processing jobs.
The Spark ecosystem, originally proposed as the Berkeley data analytics stack by its developers, remains a core technology for distributed processing. But as ScienceDirect’s research notes, “using simple Hadoop setup would not be efficient” for complex workloads. Organizations running big data analytics need performance profiling, bottleneck detection, and scenario simulation as part of their ongoing operations.
The Governance Layer Most Teams Underestimate
Successful big data analytics implementations depend on data governance. The 6 C’s of data quality provide a useful checklist: Completeness, Consistency, Conformity, Currency, Correctness, and Coverage. Each one addresses a specific failure mode. Incomplete data produces biased models. Inconsistent formats break joins between datasets. Outdated records make predictions unreliable. Organizations that treat governance as an afterthought end up with analytics outputs that nobody trusts.
For Philippine enterprises evaluating this path, the tradeoff is straightforward. Big data analytics demands the highest investment in infrastructure, talent, and ongoing management. But it also delivers the deepest capability. If you’re running real-time personalization across enterprise web platforms, processing millions of customer interactions per day, or managing attribution across dozens of marketing channels, this is where you land.
Info: Data governance isn’t a one-time setup. Treat it as a continuous function with clear accountability, security protocols, and lineage tracking. Without it, your big data analytics stack produces impressive-looking dashboards built on unreliable inputs.
The cost of getting this wrong compounds. Without governance, your analytics team spends 60–80% of their time cleaning data rather than analyzing it. That’s an expensive way to run an insight function.

How the Choice Connects to Marketing Operations
None of this lives in a vacuum. For marketing leaders briefing agencies or building internal capability, the data analytics and big data question shapes practical decisions. If you’re evaluating SEO diagnostic tools for a growing brand, you’re operating in analytics territory. If you’re building a customer data platform that unifies transaction history, web behavior, CRM interactions, and offline touchpoints across 50+ retail locations, you’re in big data analytics territory.
The distinction also matters for how you structure site architecture decisions and interpret performance data. Descriptive analytics tells you which pages lost traffic after a core update. Diagnostic analytics tells you whether the drop correlates with content quality scores, link profile changes, or technical issues. Predictive analytics tells you which pages are likely to lose position in the next quarter based on current trends.
Agencies should be transparent about which layer they’re operating in. An SEO audit that identifies 1,400+ tickets is a diagnostic analytics exercise. The prioritization framework that follows is prescriptive analytics. Neither requires big data infrastructure.
How to Choose Between These Three
The decision depends on three variables: the volume and complexity of data your organization generates, the maturity of your existing analytics practice, and the business questions you need answered.
Pick big data infrastructure if your organization generates terabytes of unstructured data daily and doesn’t yet have a reliable way to store, organize, and access it. This is an engineering-first investment. Don’t expect insights on day one.
Pick data analytics capability if you have structured data in accessible systems but lack the processes, team, or tools to extract patterns. This applies to the majority of mid-market Philippine brands. Your data exists in GA4, your CRM, your ad platforms, and your ERP. The gap is in connecting those sources and building consistent analysis workflows.
Pick big data analytics if you’re an enterprise operating at scale with data arriving from dozens of sources in real time, and you need both the infrastructure to handle volume and the analytical layer to produce continuous intelligence. This is the most expensive path and the most capable one.
The honest answer for most marketing organizations: you need better analytics, not bigger data. The constraint is rarely storage or processing power. The constraint is asking the right questions, maintaining clean data inputs, and building a reporting cadence that actually informs decisions. Investing in analytics discipline before big data infrastructure will produce results faster and cost significantly less. The organizations that get this sequence backwards end up with powerful systems that generate reports nobody reads.