How to Perform Analytics for Your Business
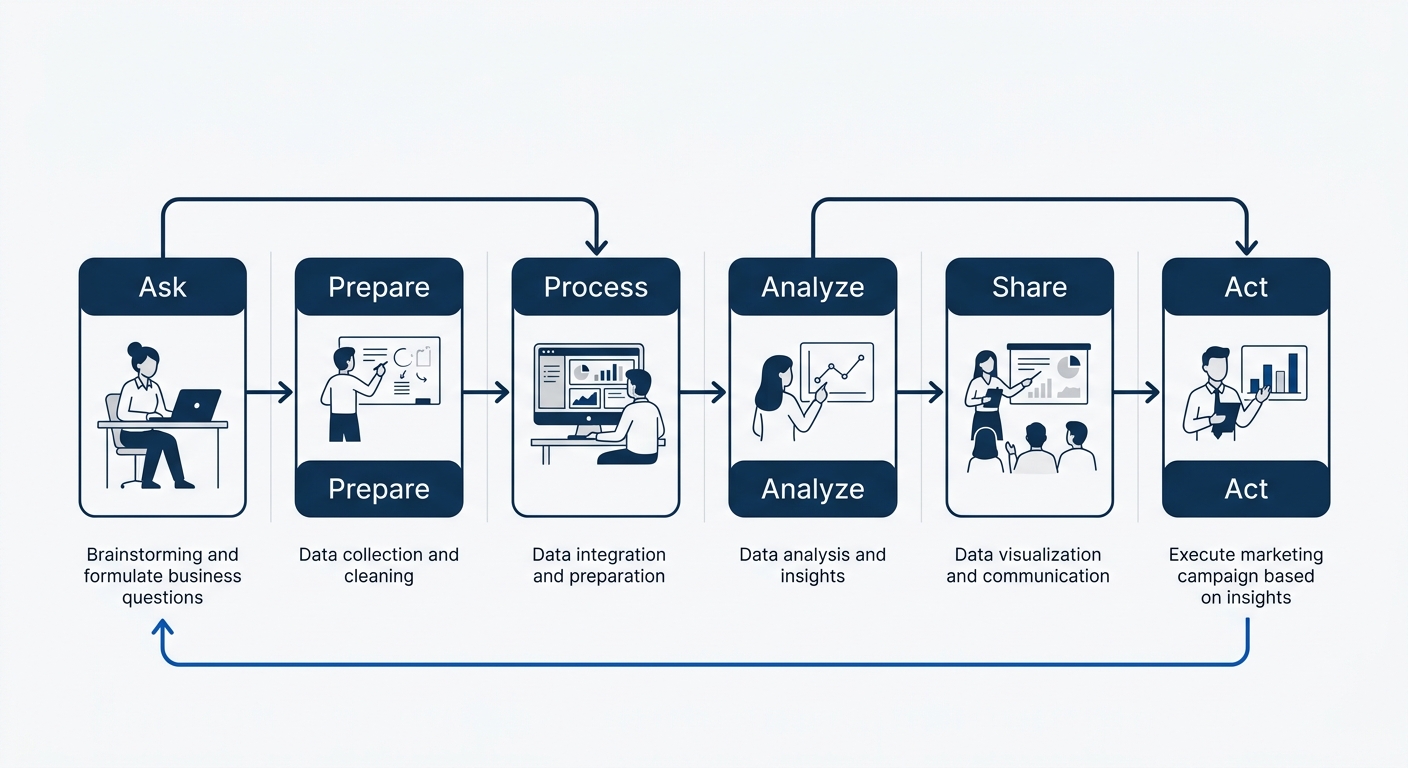
Performance analytics programs break down at the same point in nearly every organization: the gap between collecting data and connecting that data to a business question worth answering. This guide walks through the six phases of performing analytics, Ask, Prepare, Process, Analyze, Share, Act, so the metrics you track map to decisions that affect revenue. Gartner research indicates only 20% of analytics initiatives clear that bar.
TL;DR: Define measurable business questions before touching a dashboard. Follow the six-phase analytics lifecycle in sequence, and treat analytics as an ongoing product, not a one-time project. Most programs fail because they skip the first phase entirely.
Before You Start
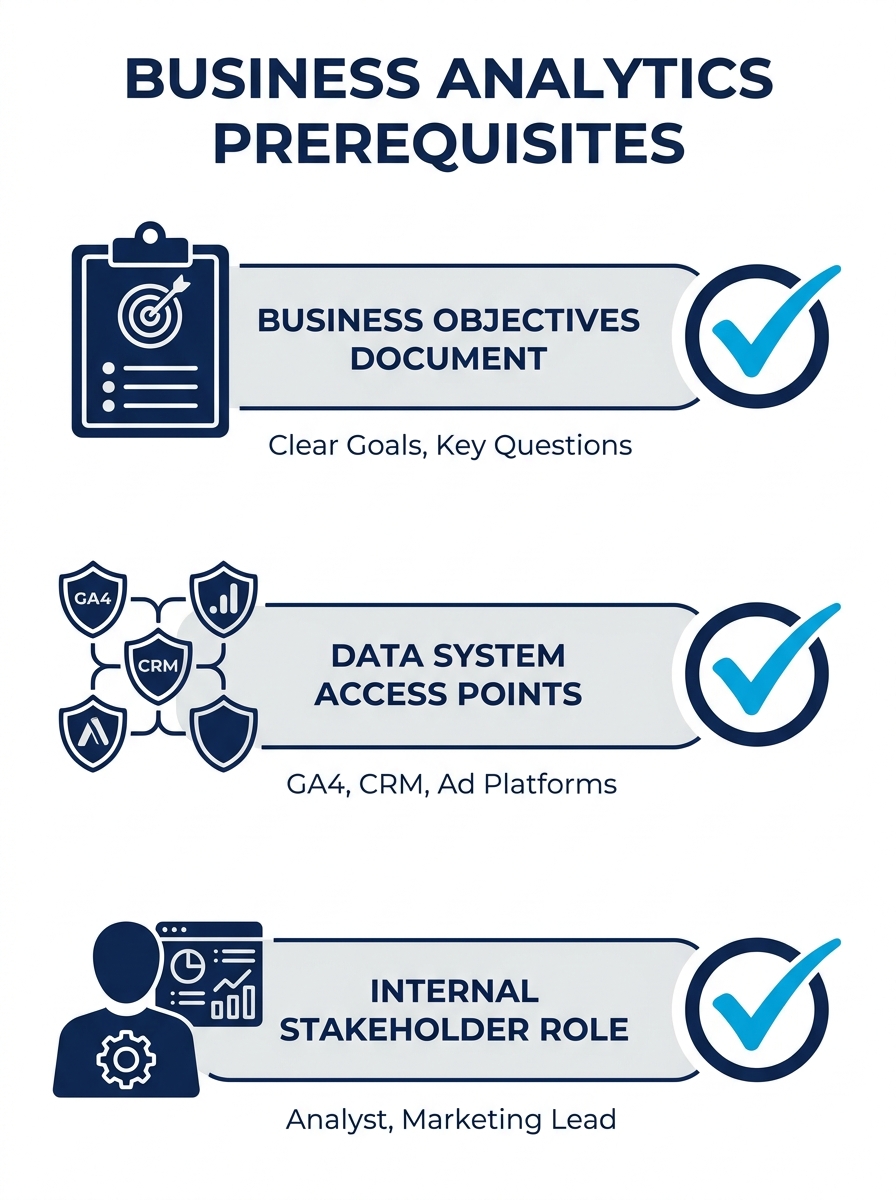
Your team needs three things in place before any analytics work produces value. Without them, every report your agency delivers will sit unread.
A single source of business objectives. This is a written document, not a verbal agreement on a call, that states what the brand is trying to achieve in the current quarter. Revenue targets, customer acquisition goals, retention benchmarks, expansion into new markets. Your analytics partner will reverse-engineer KPIs from these objectives, so vagueness here creates vagueness everywhere downstream.
Access to your data systems. Google Analytics 4, Meta Ads Manager, your CRM, your ecommerce platform’s backend, your call tracking system. Roughly 61% of CMOs in a recent industry survey flagged infrastructure gaps as their primary blocker for ROI measurement. If your agency can’t connect to your data, they can’t perform analytics on it, and that delay costs weeks.
An internal stakeholder who can validate the numbers. Someone in finance or operations who knows what “normal” looks like for your metrics. When the data says your average order value dropped 30% in a week, this person confirms whether that’s a real event or a tracking error.
Define the Business Questions
This is phase one of performing analytics, and it’s the phase most teams skip. Harvard Business School Professor Robert Simons frames the distinction clearly: “If a measure is objective, you can independently verify it,” he explains in HBS’s guide to measuring business performance. That independent verification starts with asking a question that has a checkable answer.
Bad question: “How is our marketing doing?” Good question: “Which acquisition channel delivered the highest qualified lead volume relative to spend in Q2?” The second version specifies a metric (qualified lead volume), a comparison dimension (channel), a cost relationship (relative to spend), and a time window (Q2). Your agency can build a report against that. The first version produces a 40-slide deck nobody acts on.
A useful rule of thumb: every analytics question should contain a noun (what you’re measuring), a verb (the direction you care about), and a constraint (the time frame, segment, or benchmark you’re comparing against). Performance metrics worth tracking fall into two categories, financial indicators like operating cash flow ratio and margin, and operational indicators like mean time to repair, inventory turnover, or sell-through rate. Brief your agency on which category matters for the decision you’re making right now.
You’ll know this phase worked when your analytics partner can restate your business questions back to you, and each question points to a specific metric with a defined time range.
Assess and Connect Your Data Sources
Phase two determines whether the data you have can actually answer the questions you defined. The Databricks analytics guide makes this point sharply: analytics tools are only as good as the data they can reach, and platforms that require manual exports or batch refreshes introduce latency that undermines real-time analysis.
This is where your agency audits what you have. Expect them to evaluate your data against five quality dimensions: whether it’s clean (free of duplicates and formatting errors), connected (integrated across platforms rather than siloed), current (refreshed at a frequency that matches your decision cycle), compliant (GDPR, Data Privacy Act, any applicable regulations), and correct (validated against a known source of truth).
If you’re running media buying campaigns across Google, Meta, and TikTok simultaneously, the connection step is where spend data from each platform gets unified into a single view. Without that unification, you’re comparing numbers that use different attribution windows, different definitions of a conversion, and different reporting lag times. A 2026 SAS best-practices report notes that pushing data-cleansing processes down to the database level improves performance and removes invalid records before they reach the analyst’s screen.
Warning: If your agency tells you the data audit will take “a day or two,” that should raise a flag. Connecting 3-5 data sources with proper validation typically takes 5-10 business days for a mid-market brand. Rushing this phase means the analysis phase inherits dirty data.
You’ll know this phase worked when your agency delivers a data inventory, a document listing every source connected, the refresh frequency, any gaps or quality issues found, and how those gaps will be handled.
Clean the Raw Inputs
Phase three is the least glamorous and most consequential part of the process. SAS’s data management framework recommends incorporating data cleansing directly into the integration flow rather than treating it as a separate manual step. Your agency should be doing this programmatically, not eyeballing spreadsheets.
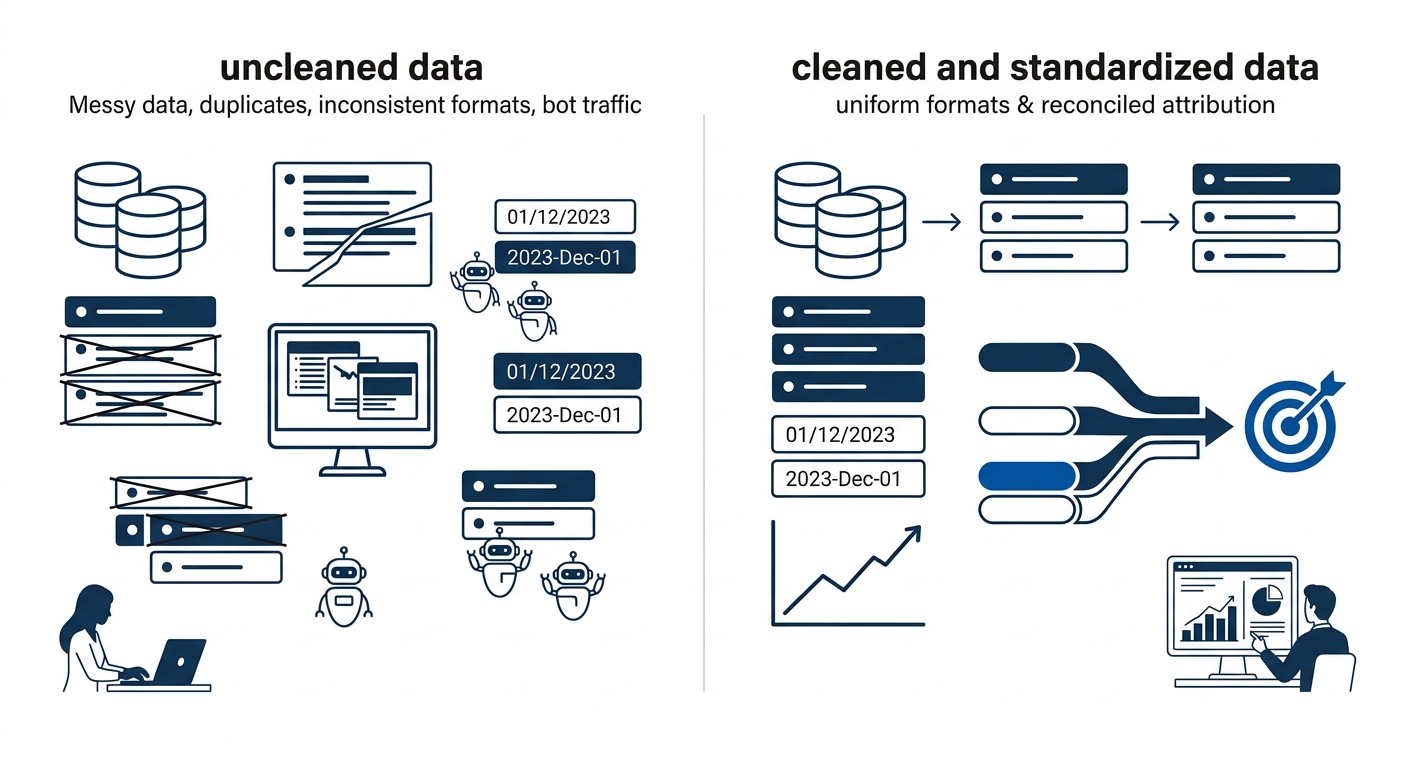
What cleaning looks like in practice: de-duplicating customer records across your CRM and your email platform, standardizing date formats between your GA4 export and your ecommerce backend, removing bot traffic from session data (which can account for 15-40% of total sessions depending on your industry and traffic volume), and reconciling attribution discrepancies where Meta claims credit for conversions that GA4 attributes to organic search.
The marketing leader’s role here is limited but important. You’re not cleaning data yourself, you’re asking your agency two questions. First: what did you remove, and why? Second: what assumptions did you make when records conflicted? Those two answers determine whether the analysis phase rests on solid ground or convenient fiction.
You’ll know this phase worked when you can look at a dashboard showing total sessions, total leads, or total revenue and the numbers align within an acceptable margin to what your internal finance or operations team independently reports. A 5-10% variance between marketing analytics and finance records is typical. A 30% variance means something in the cleaning phase went wrong.
Run the Analysis
Phase four is where the questions from phase one meet the clean data from phase three. MIT Sloan’s analytics research team recommends a critical distinction here: instead of channeling efforts into analytics projects, which are finite and tactical, organizations should build analytics products that generate continuous financial benefit from data insights. MIT Sloan Professor Prashanth Southekal’s research notes that data products are typically scalable, teams persist for continuous improvement, and the collaboration is inherently deeper.
What this means for you as the person briefing an enterprise digital marketing partner: push back on one-off report requests. Ask your agency to build repeatable analytical frameworks that refresh automatically and answer the same set of business questions each reporting cycle. A monthly channel-performance analysis that auto-populates with fresh data is an analytics product. A custom PowerPoint deck assembled manually every time your CMO asks a question is an analytics project. The product scales. The project doesn’t.
Brief your agency on building repeatable analytical frameworks that refresh automatically, not one-off decks assembled manually for every board meeting.
Three layers of analysis matter for most Philippine brands evaluating marketing performance:
- Descriptive analytics, what happened. Revenue by channel, cost per acquisition by campaign, traffic trends by week. Start here to build stakeholder trust in the data before introducing more complex models.
- Diagnostic analytics, why it happened. Segment-level drilldowns, attribution path analysis, cohort comparisons. This is where you find that your Meta campaigns perform differently for Metro Manila audiences versus Visayas audiences.
- Predictive analytics, what’s likely to happen next. Trend forecasting, budget scenario modeling, customer lifetime value projections. This layer requires at least 6-12 months of clean historical data to produce outputs worth acting on.
You’ll know this phase worked when each analysis output directly answers one of the business questions you defined in phase one, and you can explain the finding in a single sentence to a non-technical stakeholder.
Share Findings and Act on Them
Phases five and six collapse together in practice. Sharing an insight without a recommended action is a report. Sharing an insight with a specific, time-bound recommendation is a decision brief. Your agency should deliver the second kind.
The format matters less than the structure. Whether it’s a live dashboard in Looker Studio, a monthly PDF, or a 15-minute video walkthrough, every finding should follow a consistent pattern: here’s the question we asked, here’s what the data showed, here’s what we recommend doing, and here’s how we’ll measure whether that action worked. This four-part structure makes analytics actionable rather than decorative.
If your organization has adopted answer engine optimization practices or adjusted strategy after Google’s March 2026 core update, the Share-and-Act phase is where those platform shifts translate into measurable next steps, reallocation of budget, content calendar changes, or updated bidding strategies.
You’ll know this phase worked when a decision is made within five business days of delivering the analysis. If reports sit for weeks before anyone acts, the cadence or format needs adjustment.
When the Program Stalls
Three failure modes account for the majority of analytics programs that stall after the first quarter.
The data connection breaks silently. A GA4 tag stops firing after a site update, a UTM convention changes without documentation, or an API token expires. The dashboard keeps displaying data, just incomplete data. Spot this by scheduling a monthly data-integrity check where your agency verifies that source record counts match destination record counts within a 5% tolerance.
The questions go stale. You defined business questions in Q1, but the business pivoted in Q2. If nobody updates the analytics brief, your agency keeps answering questions that no longer matter. Schedule a quarterly review of your analytics brief alongside your marketing measurement framework to keep questions current.
The findings never reach the decision-maker. A common pattern in organizations with multiple layers of management: the analyst shares the insight with a marketing manager, who summarizes it for a director, who mentions it in passing to the VP. By the time it reaches someone who controls budget, the original finding is distorted or delayed by weeks. Fix this by giving the analytics lead direct access to the quarterly business review meeting, even if only for 10 minutes.
Tip: Ask your agency to flag anomalies proactively rather than waiting for a scheduled report. A sudden 40% drop in conversion rate on a Tuesday afternoon is worth a same-day alert, not a footnote in next month’s deck.
Where to Go From Here
The six-phase lifecycle, Ask, Prepare, Process, Analyze, Share, Act, works as a repeating loop, not a one-time project. Each cycle through the loop should sharpen the questions, improve the data quality, and increase the speed at which findings turn into decisions. Organizations that treat analytics as a product rather than a project, per MIT Sloan’s research, see measurably better financial outcomes because the team sticks around for continuous improvement rather than disbanding after delivery.
If your organization hasn’t formalized this process yet, a useful starting point is a digital marketing consultation focused specifically on auditing your current data infrastructure and identifying which of the six phases is your weakest link. Most brands discover the gap sits in phase one (poorly defined questions) or phase five (findings that never reach stakeholders), and fixing either of those produces visible impact within a single quarter. The analytics capability exists. The discipline to connect it to business outcomes is the part that takes work.