The Technical SEO Audit Multiplier: How to Map 185-310% Organic Growth in Your First 6 Months

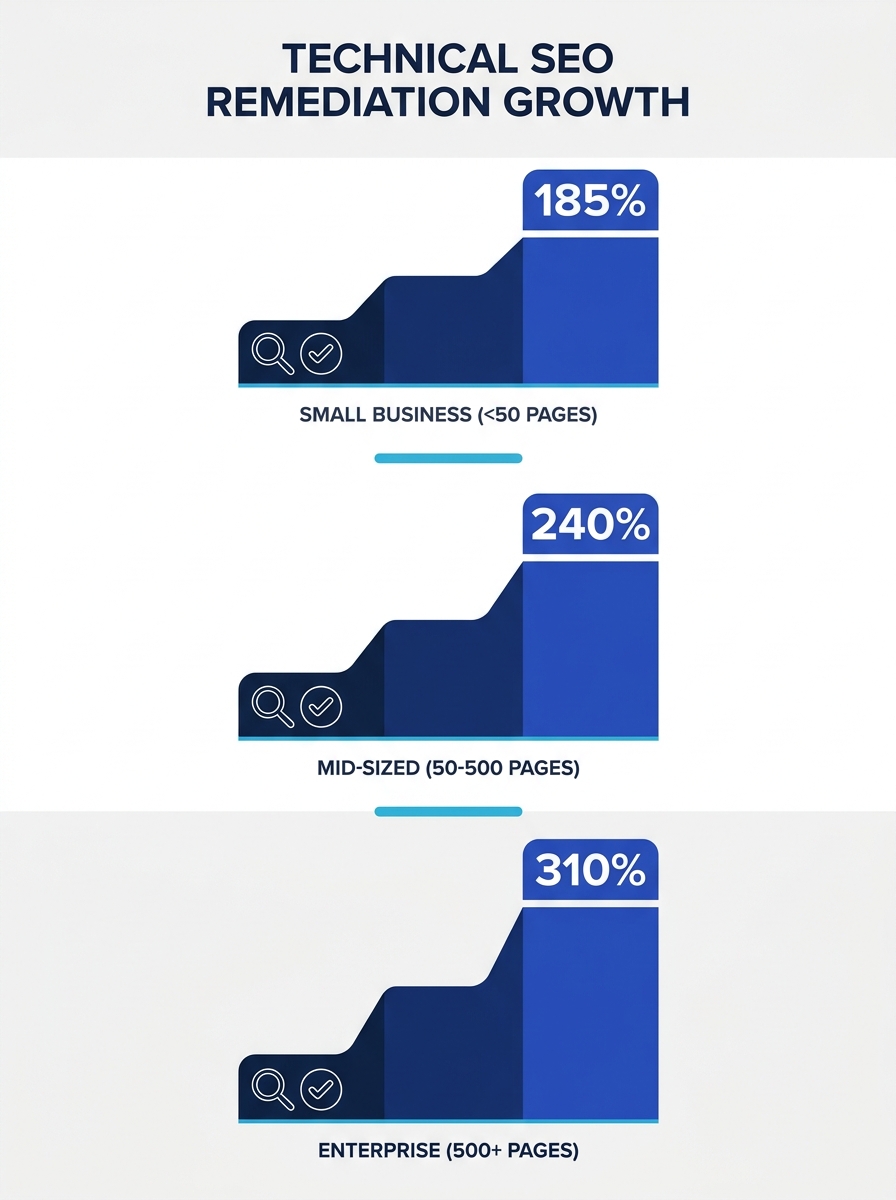
Seventy-one percent of websites audited in a January-to-March 2026 study of 12,000 domains were missing alt text on images. Sixty-seven percent had duplicate or absent meta descriptions. Fifty-eight percent failed Core Web Vitals on mobile. These aren’t obscure technical flaws buried deep in a codebase. They’re the kind of baseline hygiene items that any competent technical SEO audit framework catches in the first crawl pass. And yet the same study found that when these issues were systematically remediated, organic traffic grew between 185% and 310% within six months, with the largest gains concentrated on sites with 500 or more pages.
That spread is worth sitting with for a moment, because it tells you something important about where growth actually lives for most Philippine brands investing in organic search. The compound effect of fixing technical debt across hundreds or thousands of URLs is categorically different from the incremental lift you get from publishing three more blog posts per month. Content matters, links matter, but if the infrastructure underneath is suppressing your pages from being crawled, indexed, and rendered properly, you’re spending on fuel for an engine that can’t turn over.
Why Technical Debt Compounds Faster Than Content Debt
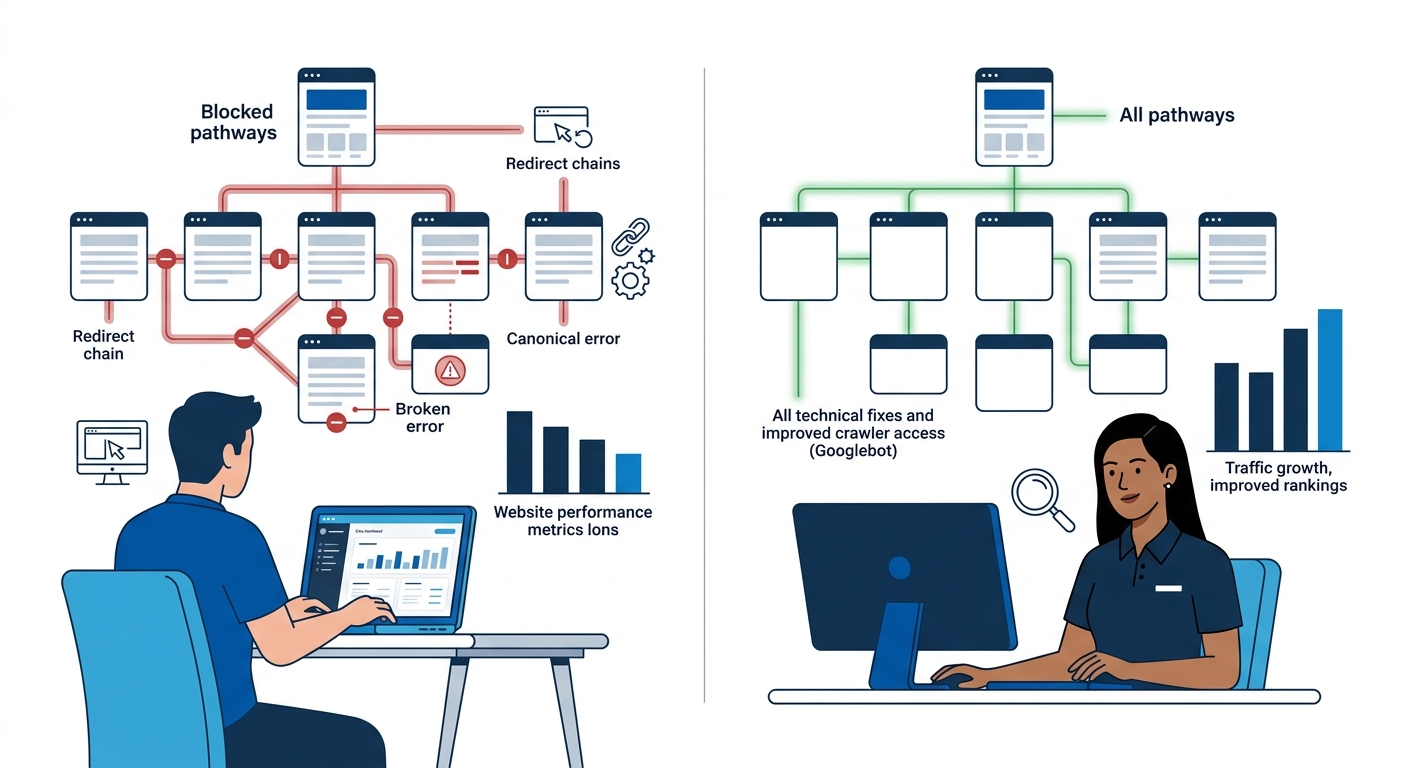
The instinct for most marketing teams—and many agencies, frankly—is to treat technical SEO as a one-time cleanup before the “real” work of content production and link building begins. That framing misunderstands how search engines allocate resources to your site. Google’s own documentation on troubleshooting crawl errors makes the point plainly: review your crawling priorities, meaning use your crawl budget wisely. Every URL that returns a soft 404, every redirect chain that bounces a bot through three or four hops before landing, every orphaned page that no internal link points to doesn’t just affect the individual page in question. These issues degrade Googlebot’s efficiency across your entire domain, which means your best content gets crawled less frequently and indexed more slowly.
The compounding dynamic works like this: a mid-sized e-commerce site with 300 product pages might have 40 of those pages trapped behind redirect chains, another 25 returning intermittent server errors, and 60 with canonical tags pointing to the wrong URL. None of those individual issues feels catastrophic when you spot them in a Screaming Frog crawl report. But collectively, they mean that roughly 40% of the site’s commercial pages are either invisible to Google or competing with themselves for ranking signals. Fix them in a coordinated sprint, and you don’t get a proportional 40% lift. You get a multiplicative effect, because the crawl budget previously wasted on dead ends gets reallocated to pages that actually convert.
This is why the research data shows enterprise sites (500+ pages) hitting 310% average organic traffic increases after remediation, while small business sites under 50 pages see closer to 185%. The larger the site, the more technical debt has accumulated in hidden corners, and the bigger the unlock when you clear it systematically. For Philippine brands running on legacy CMS platforms or managing multi-location pages across dozens of branches, the debt tends to be substantial. If your team has been focused on building dashboards that track revenue-linked SEO metrics, technical remediation is the upstream fix that makes those metrics move.
Prioritizing Fixes by Impact, Not by Spreadsheet Row
The output of most audit tools, whether Screaming Frog, Sitebulb, Ahrefs, or Semrush, is a spreadsheet with hundreds or thousands of line items. The temptation is to start at row one and work down. That approach wastes the first eight weeks on issues that might affect pages nobody visits, while critical landing pages sit broken. The smarter framework groups fixes into themed sprints and sequences them by a simple two-axis matrix: how much traffic does the affected page (or page group) already receive or could receive, and how much engineering effort does the fix require?
The first sprint should always target crawl and indexation blockers on your highest-value pages. That means fixing noindex tags accidentally applied to product or service pages, repairing broken internal links on your homepage and primary category pages, correcting canonical tags on pages that drive revenue, and collapsing redirect chains that eat crawl budget on your money URLs. These fixes are well-documented in any solid technical SEO checklist and they’re also, in most cases, fast to implement. A single afternoon of dev time can unblock pages that have been suppressed for months or years. When brands ask us why their content investment isn’t producing proportional organic growth, the answer often lives here, in indexation problems that content strategies can’t override.
The larger the site, the more technical debt has accumulated in hidden corners, and the bigger the unlock when you clear it systematically.
The second sprint addresses Core Web Vitals and page performance. The current thresholds are well established: Largest Contentful Paint under 2.5 seconds, Interaction to Next Paint under 200 milliseconds, Cumulative Layout Shift below 0.1. Fifty-eight percent of sites failing these thresholds on mobile is a staggering number, especially in the Philippine market where mobile traffic dominates. Fixing these often requires coordination between your agency and your dev team around image compression, render-blocking scripts, and layout stability. This work takes longer than canonical tag corrections but delivers a meaningful lift to both ranking and on-page experience. We’ve written before about why Core Web Vitals remain a competitive lever in Philippine e-commerce, and the data from this year’s audits only reinforces that position.
The third sprint covers structured data, schema markup, and accessibility fundamentals. Pages using ARIA attributes have increased 27% year-over-year, but they average 59.1 errors per page, significantly more than pages without ARIA, which average 42 errors. The lesson here is that bolting on accessibility or structured data without understanding the underlying HTML often creates more problems than it solves. Your agency should be auditing schema completeness and validating that structured data matches on-page content before expanding markup to new page types. Rich result appearances are a KPI worth tracking post-remediation, and they compound over time as Google gains confidence in your site’s data quality. Technical SEO fixes prioritization, when done this way, prevents the common trap of spending engineering resources on low-visibility improvements while high-traffic pages remain broken.
The Six-Month Reality Check
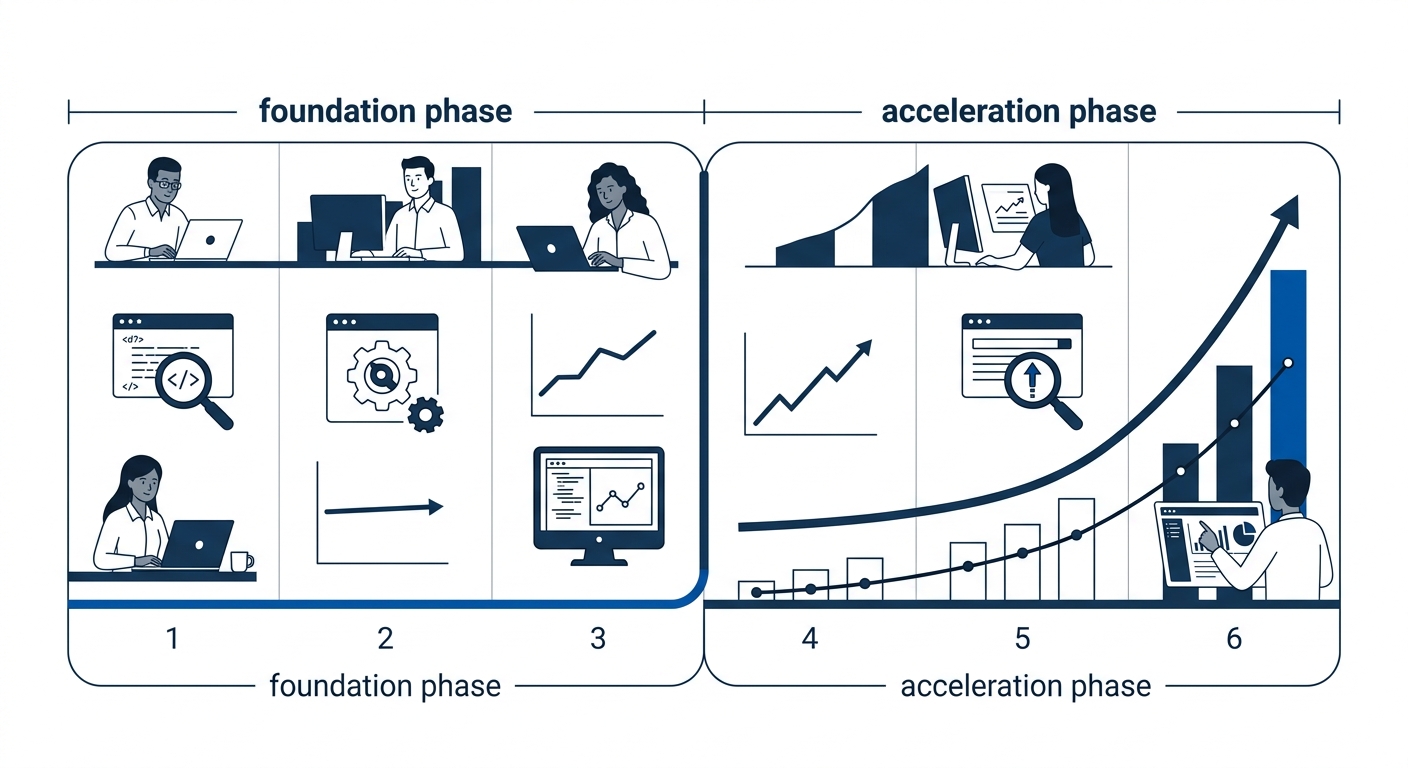
The 185–310% growth range is empirically supported, but it’s important to be honest about what the timeline actually looks like month by month, because executive stakeholders rarely have patience for “wait six months.” The first three months are foundation work: running the audit, prioritizing the fix backlog, executing the first two or three sprints, and waiting for Google to re-crawl and re-index the affected pages. According to Shopify’s analysis of SEO timelines, most websites see initial ranking improvements between months three and six, with domain age, backlink profile, and competitive landscape affecting speed. DMX Marketing’s research echoes this, noting that visibility can appear faster than clicks compound, especially as AI-driven search surfaces content through new channels.
What this means practically is that your Google Search Console data will show crawl stats and index coverage improving within weeks of deploying fixes. Pages that were previously “Discovered – currently not indexed” will start moving into the index. But ranking movement and traffic lift lag behind indexation by four to eight weeks, and commercial keyword positions often lag further because they’re more competitive. The growth curve is hockey-stick shaped, not linear: flat or modest in months one through three, then accelerating sharply in months four through six as the remediated pages start accumulating click and engagement signals that reinforce their positions.
The mistake many brands make is treating the audit as a one-time event and then shifting budget entirely to content and link building after the initial fixes ship. Quarterly audit cadence is now the recommended practice specifically because technical regressions happen constantly. A CMS update overwrites your canonical tags. A developer pushes a JavaScript change that breaks server-side rendering. A product team archives a category page without implementing proper redirects. Each of these individually might cost you a few positions on a handful of pages. Left unchecked for six months, they erode the gains you worked to build. The systematic website optimization ROI depends on maintenance discipline as much as the initial remediation effort, and your agency relationship should be structured to include ongoing monitoring rather than project-based audits with gaps between them. This is one of the reasons choosing the right SEO partner matters so much at the enterprise level: the value isn’t in the initial audit report, it’s in the ongoing discipline of catching regressions before they show up in your traffic numbers.
Where the Multiplier Metaphor Gets Uncomfortable
The framing of technical SEO as a “multiplier” is useful because it accurately describes the compounding math. Fix the infrastructure, and every piece of content and every backlink you’ve already earned works harder. But it can also create unrealistic expectations if you don’t account for the variables that the multiplier doesn’t control. A site with thin content on its key commercial pages will see crawl and indexation metrics improve dramatically after an audit, but the ranking lift will plateau because Google can now efficiently crawl pages it still doesn’t find particularly useful. Resolving technical suppression is necessary. Resolving relevance is a separate problem entirely.
Similarly, the 310% figure for enterprise sites assumes those sites had substantial existing content that was being held back by technical issues. A brand-new 20-page site can’t multiply its way to meaningful organic traffic through technical fixes alone because there isn’t enough surface area for the multiplier to act on. The organic traffic multiplier in 2026 operates on existing assets: your current pages, your current link equity, your current topical authority. If those assets are strong but suppressed, remediation produces dramatic results. If they’re weak, you’re multiplying a small number, and the absolute gain will feel underwhelming even if the percentage increase looks impressive on a slide.
The honest version of the pitch is this: a technical SEO audit framework tells you exactly how much unrealized potential your current site is sitting on. For brands with real content depth, established domains, and years of accumulated backlinks, the suppressed value is often enormous, and unlocking it is the highest-ROI activity available in organic search. For brands earlier in their growth curve, the audit is still essential because you need clean infrastructure before investing in content and links, but reframing the strategy around revenue contribution rather than traffic volume is what keeps expectations aligned with reality. The multiplier is real. The variable it acts on is the part most people forget to examine, and getting that variable right is the difference between an impressive percentage in a report and a material change in the business.