How to Measure Your Email Marketing Success

Email marketing works. But only if you can prove it. If all you have is a gut feel and a few screenshots from your ESP, you don’t really have a program yet—you have a habit.
Here’s the thing. Success in email isn’t one number. It’s a stack of signals, and each layer tells you a different story. Miss one, and you’ll optimize the wrong thing.

This guide shows you what to track, why it matters, and how to make the numbers add up to business outcomes. No fluff. No vanity metrics. Just a system you can run every week without losing your mind.
What “success” actually means in email
Success depends on your goal. But it should never be “more opens.” Opens are shaky now, thanks to privacy changes and prefetching. Treat them as a trend, not a scorecard.
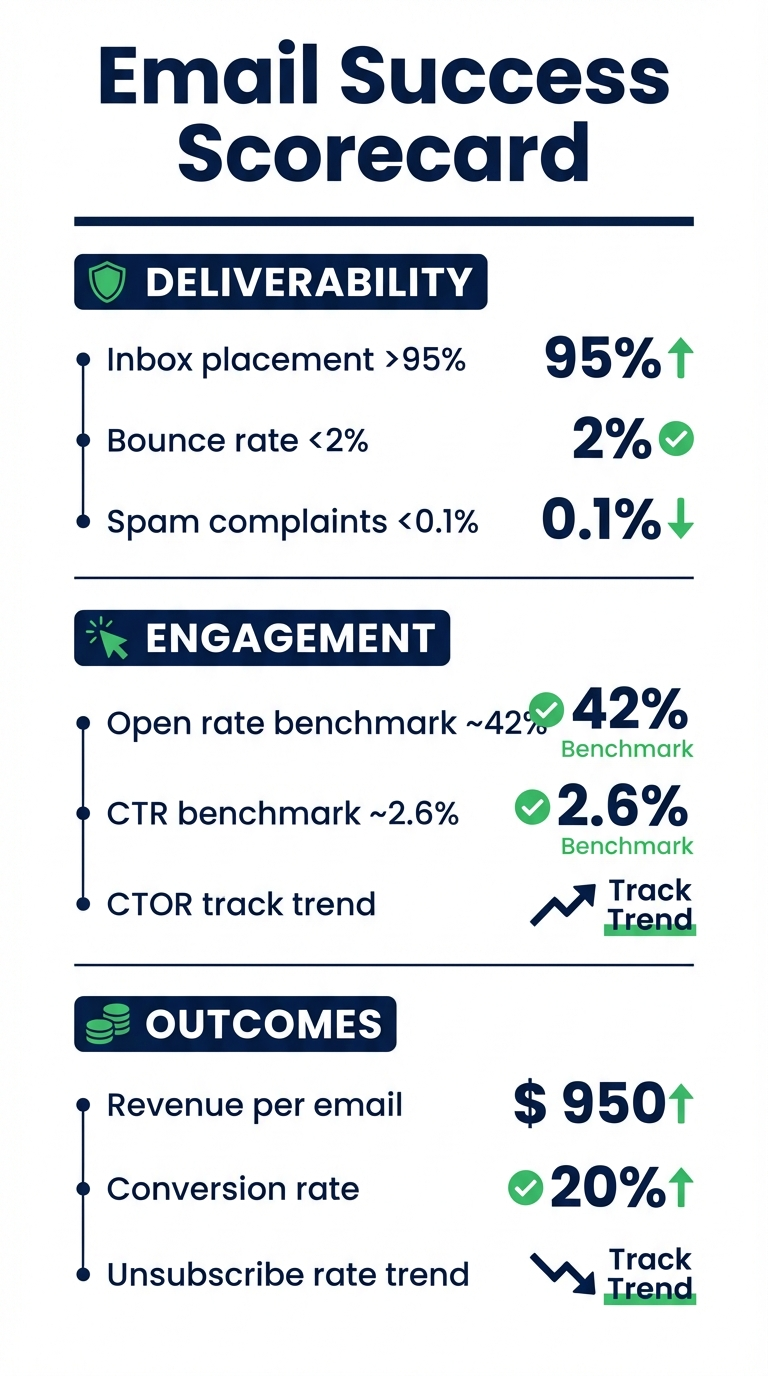
So what do you measure? Think of three layers:
Keep all three. Drop any one and you’ll end up chasing the wrong KPI.
If you want a quick refresher, our email marketing guide breaks down the basics, and this campaign setup walkthrough shows how to structure sends. For automation-heavy teams, see our marketing automation guide.
Layer 1: Deliverability is the silent killer
If messages don’t land in the inbox, nothing else matters. Harsh, but true.

Start with the basics: delivery rate, bounce rate, and spam complaints. Gmail and Yahoo now enforce stricter rules, and even a handful of spam complaints can sink your sender reputation. Mailgun’s 2025 deliverability report points out that just one complaint per 1,000 emails is a 0.1% spam rate, and hitting 0.3% is already a red flag.
So what do you do with that?
Say you’re a mid-size BPO in Makati sending 60,000 emails a month. A 2% hard bounce rate means 1,200 dead addresses. That alone can drag deliverability down even if your content is decent. Fix the list first.
Layer 2: Engagement that isn’t fake
Engagement is where most teams get lazy. Open rate gets all the attention, but click behavior tells you if your email did any real work.

ActiveCampaign’s 2025 benchmarks show a typical open rate around 42.35% and an average click-through rate near 2.62%. Use those as directional guides, not commandments.
Now, ask the harder questions:
Don’t overthink benchmarks. Instead, compare your own sends over time. If your CTR jumps after tightening your subject lines, keep going. If it drops after sending to a cold list, that’s the signal, not a mystery.
Layer 3: Outcome metrics that finance actually respects
You can’t call a program “successful” if it doesn’t move money. That sounds harsh, but it’s the only way to keep budget.

Use at least one revenue metric. Two is better.
If you’re ecommerce, you should also track assisted revenue. A welcome sequence that brings someone back in 7 days is still doing its job, even if the last click came from search.
Need a sanity check? Recent 2026 roundups still peg email at around $36 for every $1 spent. That number is not a promise. It’s a reminder that email should earn its keep.
Build a reporting cadence that doesn’t collapse
Weekly is your friend. Daily is too noisy. Monthly is too late.
Here’s a simple rhythm that works for most teams:
So what does this actually mean? You’re not drowning in numbers. You’re spotting patterns early, then moving fast before the damage spreads.
Build a dashboard you’ll actually use
Don’t build a monster spreadsheet. Build a one‑page view with the five numbers you check every Monday. That’s it.
For example, track delivery rate, CTR, CTOR, RPE, and unsubscribes. Put the last four weeks in a simple table. If a number slips two weeks in a row, that’s your signal. You don’t need a data team to see it.
And yes, set thresholds. If spam complaints hit 0.1%, pause new campaigns and clean the list. If RPE falls 20% month‑over‑month, review the offer before you blame the copy. The point is simple: numbers should force action, not just create slides.
Attribution: stop pretending it’s perfect
Email attribution is messy. It always will be. That doesn’t mean you can ignore it.
Use last-click for day-to-day decisions. Use assisted or multi-touch for strategy. If your sales cycle is long, widen your lookback window beyond 7 days. And please don’t compare newsletters to cart-abandon flows—they play different roles.
If you want a simple model for ecommerce: treat email like a revenue multiplier, not a last-click hero. Example: a weekly promo might generate ₱120,000 in direct revenue, but another ₱80,000 shows up through branded search the next week. Count both. It’s still your program doing the work.
Benchmarks are useful, but only if you earn the right to use them
Benchmarks can guide you, but they don’t know your list quality, your offer, or your market. If you’re a B2B software company, you’ll naturally see different behavior than a fashion retailer. That’s normal.
Still, it helps to have a baseline. Use these numbers as a rough signpost, not a target:
Want a more local angle? Use regional segmentation and compare one Philippine segment to another. The relative gap tells you more than any global benchmark ever will.
Make measurement actionable, not just pretty
Data doesn’t help if it doesn’t change behavior. So tie each metric to a decision.
Examples you can steal:
And yes, you can test. But test the right thing. Subject lines are easy. Offer clarity is harder—and usually more profitable.

A quick note on privacy changes (and why opens lie)
Apple’s Mail Privacy Protection inflates opens. Gmail’s prefetching can do the same. That doesn’t make open rate useless, but it makes it noisy.
So what do you do? Shift your focus to clicks and conversions. If your CTOR is rising, you’re doing something right. If open rates are high but clicks are dead, your subject line is a promise you didn’t keep.
Local context: Philippines audiences behave differently
Filipino subscribers are often mobile-first and price-sensitive. That changes how they react to timing, subject lines, and offers.
So if you’re sending to an audience in Metro Manila, try segmenting by device. Example: a mobile-heavy segment might respond better to shorter copy and a single CTA. Desktop-heavy segments can tolerate longer product detail. That’s not theory. You can test it in a week.
If you need help tightening your segmentation and measurement stack, our email marketing services team can walk you through a clean, measurable program. We also pair email with marketing automation so your metrics map to real customer journeys.
Common mistakes that tank results
These are the ones we see repeatedly. And yes, they’re fixable.
FAQs
What is the most important email marketing metric?
There isn’t one. But if you force me, start with deliverability. If your inbox placement is weak, every other metric is lying to you.
What open rate should I aim for in 2026?
Benchmarks put average open rates around the low 40s, with CTR around 2–3%. Use them as a rough reference, then measure your own trends over time.
How often should I report email performance?
Weekly for engagement and deliverability. Monthly for revenue and segment health. Quarterly for attribution and strategy.
Should I still track open rate?
Yes, but treat it like a weather report. It shows direction, not certainty. Clicks and conversions are the real anchor.
Next steps
If you want a clean, measurable email program that actually pays for itself, pair email with strong content and smart segmentation. Our content marketing team can help you build the assets that make your emails worth opening.
Or just start small. Tighten one KPI this week. Then the next. Momentum is real in email, and so is compound growth.