Beyond Vanity Metrics: Building an SEO Dashboard That Actually Predicts Revenue for Philippine SMBs

Paid search campaigns on a mid-size e-commerce site were converting at 2-3%, which felt normal until the team cross-referenced their organic channel. Same keywords, same landing pages, nearly double the conversion rate from organic visitors. That discrepancy surfaced in a Reddit PPC discussion where the poster noted significant keyword overlap between paid and organic campaigns, then asked whether the gap was normal. The answer, from dozens of practitioners, was yes—but the more interesting takeaway was that almost nobody in the thread had a dashboard that connected either channel’s performance to actual revenue. Their reporting showed traffic going up, rankings improving, conversions ticking along. None of it answered the question the business owner actually cared about: how much money did organic search put in the bank this month?
This is the gap we’re going to dissect—through the lens of one common scenario that plays out across Philippine SMBs every quarter.
The Conversion Gap Nobody Was Measuring
The Reddit poster’s situation is useful because it’s so ordinary. A business runs paid and organic simultaneously, targets overlapping keywords, and ends up with two sets of performance marketing KPIs that tell contradictory stories. Paid shows a clean cost-per-acquisition. Organic shows higher conversion rates but muddier attribution. The SEO dashboard—if one exists at all—tracks rankings, traffic volume, bounce rate, and maybe keyword positions.
Here’s the problem with that setup: none of those metrics predict revenue. Rankings can climb while revenue stays flat. Traffic can double because you’re pulling in informational queries that never convert. Bounce rate can drop because users scroll further on a blog post they’ll never return to.
For Philippine SMBs, this problem compounds. The typical marketing budget runs between ₱50,000 and ₱300,000 per month. That’s tight enough that every metric on a dashboard needs to earn its pixel. Yet the default SEO dashboard setup SMBs use—often a free Looker Studio template connected to Google Search Console—measures visibility, not value.
The first thing the Reddit case made clear: the organic channel was outperforming paid on conversions, but the business had no framework for understanding why or predicting whether that would continue. They were sitting on the most important signal in their data and treating it as a curiosity.
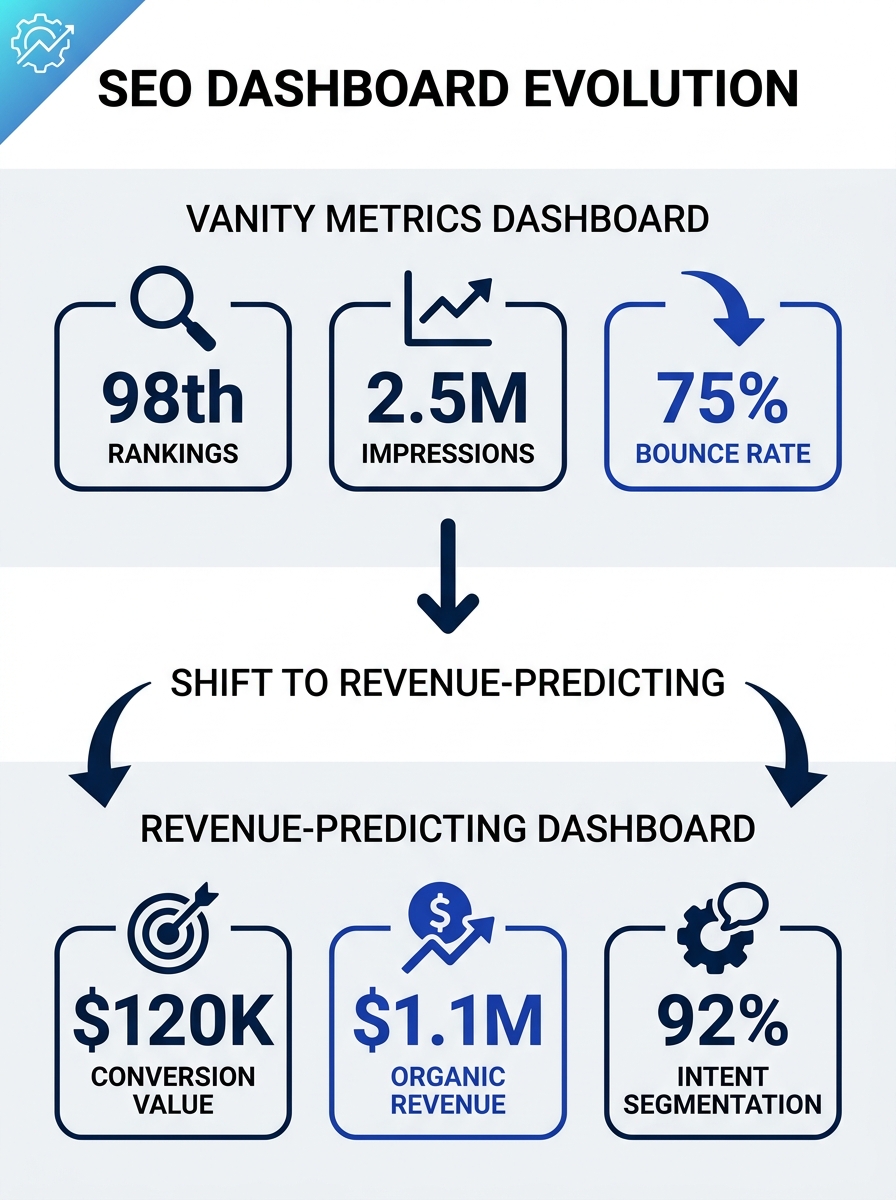
Seventeen Metrics Collapsed Into Five
The typical SEO report we see from Philippine SMBs who come to us for a digital marketing audit contains somewhere between 12 and 25 metrics. Domain authority, total backlinks, organic sessions, pages per session, average session duration, keyword rankings across dozens of terms, impressions, clicks, CTR, and a handful of conversion numbers that may or may not be configured correctly in GA4.
That’s a reporting problem, not an insights problem. As Yellowball’s guide to dashboard design puts it, a clean executive dashboard with 10 strong KPIs beats a complex 50-metric build. For small and mid-size Philippine businesses, we’d go further: five KPIs, properly wired, will tell you more than seventeen poorly connected ones.
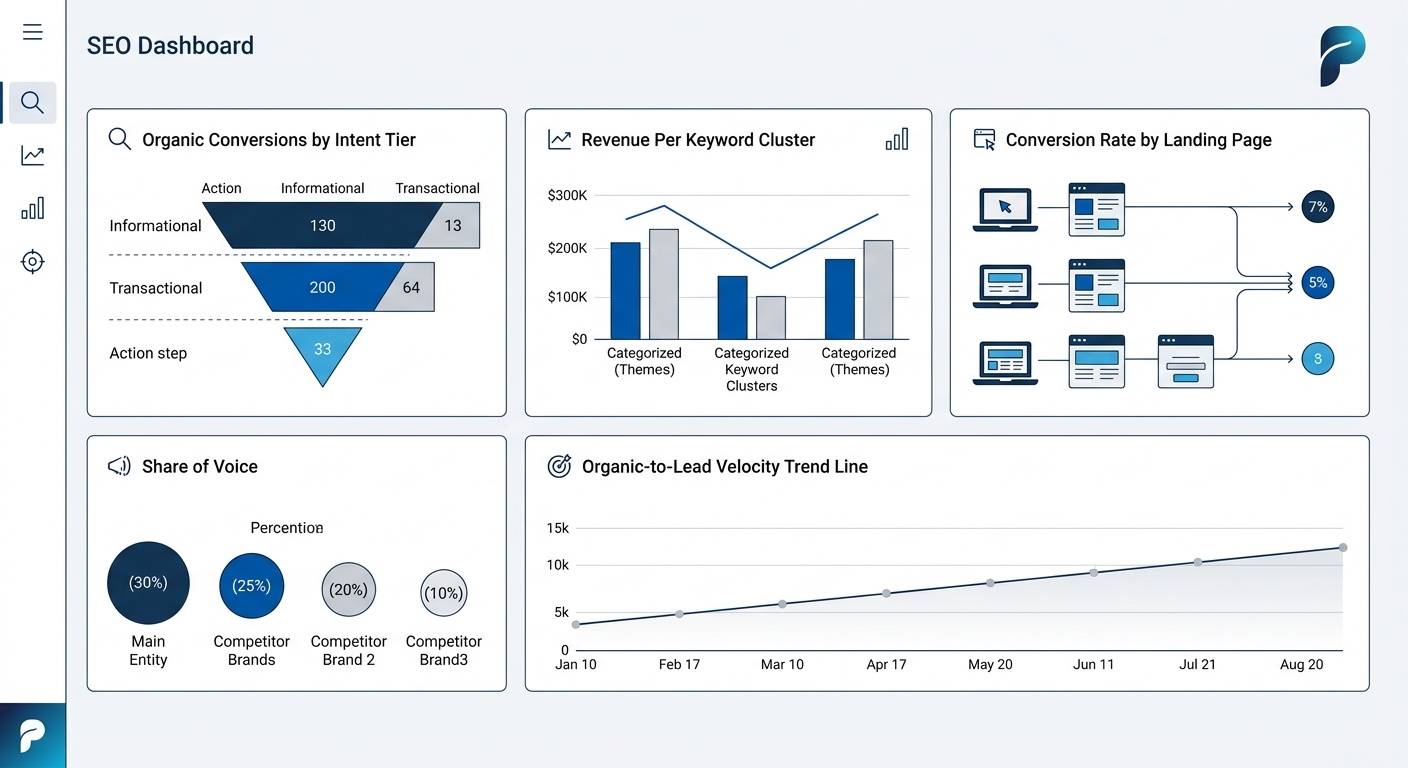
The five that actually predict revenue:
- Organic conversions by intent tier. Not total conversions—conversions segmented by whether the keyword was informational, commercial, or transactional. A buying guide about “best headphones for airplanes” will convert at a lower rate than a specific product search because the audience is still gathering information. Your dashboard needs to reflect that difference, not average it away.
- Revenue per keyword cluster. Group your ranking keywords by product category or service line, then attribute revenue to each cluster. This is the SEO metric that drives revenue conversations in boardrooms, because it tells you where organic search is earning money and where it’s generating noise.
- Conversion rate by landing page. Not site-wide conversion rate. Page-level. A 10-20% quarterly increase in organic goal completions is a strong indicator for small businesses in competitive markets, but that number means nothing if you can’t identify which pages are pulling the weight.
- Organic-to-lead velocity. How many days between a user’s first organic visit and their conversion? If you’re selling real estate in Cebu, that cycle might be 45 days. If you’re selling skincare in Metro Manila, it might be 3. Your dashboard should show this number trending, because shortening it is a direct revenue lever.
- Share of voice against your three closest competitors. This is SEO market share—the percentage of total clicks for your target keyword set that land on your site versus competitors. A growing share of voice predicts revenue growth even when traffic is temporarily flat.
Everything else—domain authority, total impressions, raw traffic counts—is context, not signal. Track them in a secondary tab if you want, but they don’t belong on the primary view.
Intent Segmentation Changed the Revenue Math
Back to the Reddit case. The poster noticed organic was converting at roughly double the rate of paid, even with overlapping keywords. The most likely explanation, confirmed by multiple respondents in the thread: organic visitors on commercial and transactional queries carry higher intent than paid visitors on the same terms. They’ve already filtered themselves by scrolling past the ads. They trust the organic result more, or they’re on a return visit that GA4 attributes to organic rather than paid.
This insight is critical for setting organic conversion benchmarks Philippines businesses can actually use. The raw average organic conversion rate across industries hovers around 2-5%, but that number is almost useless without intent segmentation. A transactional product page on a Shopify store targeting “buy Korean skincare Manila” might convert at 8%. An informational blog post targeting “skincare routine for humid weather” might convert at 0.3%. Averaging those gives you 4.15%, which describes neither page accurately.
If your dashboard averages conversion rates across intent tiers, it’s lying to you with correct numbers.
When you segment, the revenue prediction sharpens. Here’s how:
- Transactional pages (product pages, pricing pages, booking pages): These should be measured by direct conversion rate and revenue per session. If conversion drops here, that’s a revenue alarm.
- Commercial investigation pages (comparisons, “best of” lists, reviews): These convert at 3-5x the rate of blog posts and should be measured by assisted conversions. Did someone visit this page and then buy within 30 days?
- Informational content (guides, how-tos, educational articles): Measuring these by direct conversion is, as one marketer put it, “a misalignment between the metric and the page’s actual job.” Track engagement depth and downstream navigation—did the reader click through to a product page?
Philippine SMBs often run into trouble here because their CMS or agency reports lump all organic traffic into one bucket. If you’ve already configured GA4 e-commerce tracking properly, the data for this segmentation exists. You just need custom channel groupings or content groups to surface it.
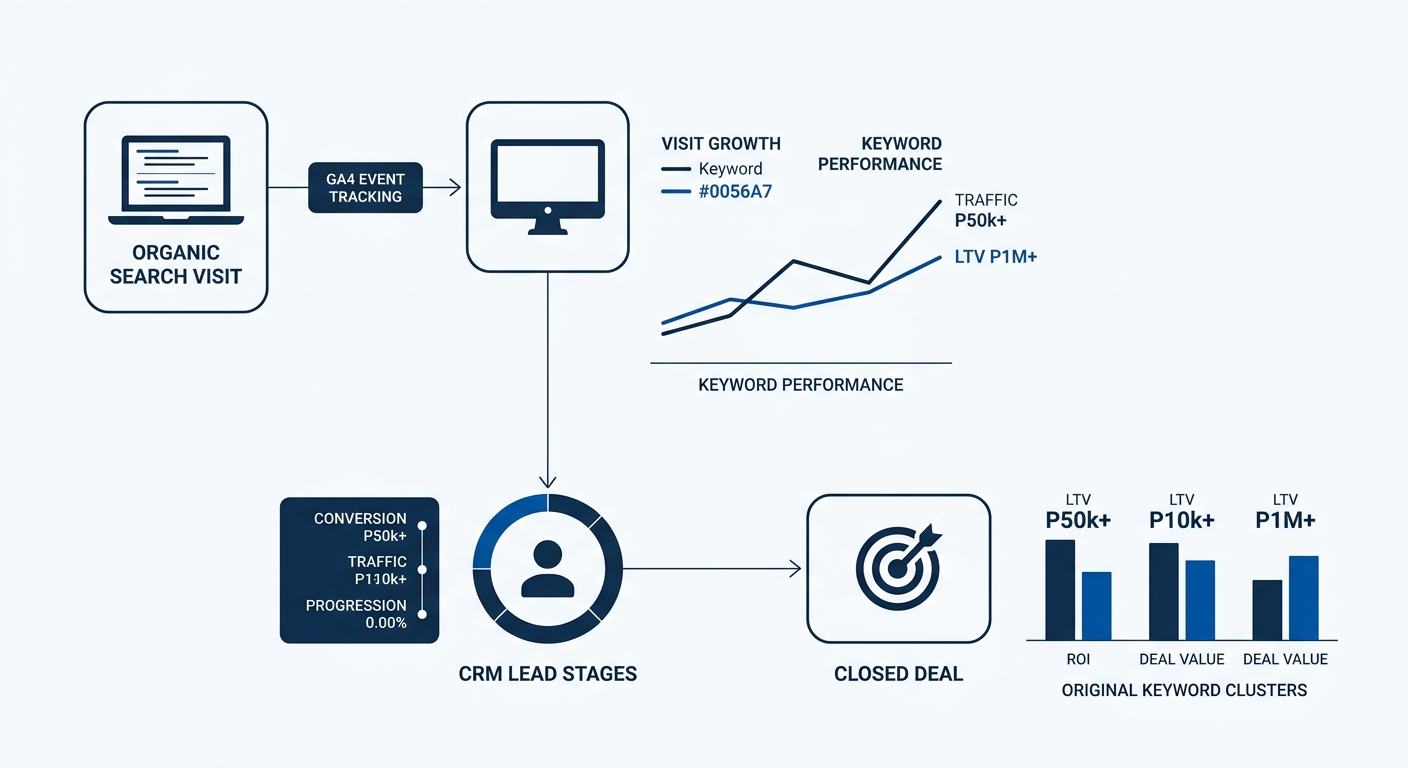
Wiring Peso Revenue to Keyword Clusters
The actual mechanics of connecting organic search to revenue depend on your business model, but the principle is the same: every keyword cluster needs a peso value, and that value needs to update monthly.
For e-commerce, this is relatively straightforward. GA4’s purchase event ties revenue to the session source. You group your tracked keywords into clusters (e.g., “women’s sneakers,” “men’s running shoes,” “kids’ school shoes”), tag the landing pages that target those clusters, and pull revenue attribution by content group. The math works.
For service businesses—which make up the majority of Philippine SMBs we work with—it’s messier. A law firm in Makati doesn’t close a ₱200,000 retainer in a single session. The organic visit might generate a form fill, which becomes a call, which becomes a consultation, which becomes a client 60 days later. To track this, you need:
- GA4 configured with lead-stage events (form_submit, call_click, consultation_booked)
- A CRM that accepts UTM parameters or gclid/session identifiers (if you’re weighing CRM options, our comparison of HubSpot vs Salesforce for Philippine businesses covers the specifics)
- A monthly reconciliation where closed deals are tagged back to their originating keyword cluster
This is where most dashboards break. The SEO agency reports traffic and rankings. The sales team reports closed deals. Nobody connects the two. And so the CEO looks at the SEO dashboard, sees green arrows on traffic, and still can’t answer whether organic search paid for itself.
The fix isn’t complicated, but it requires discipline. Once a month, export your closed deals, trace them back to their first organic touchpoint, and update your keyword cluster revenue figures. After three months, you’ll have enough data to forecast: “This keyword cluster generates approximately ₱X in revenue per 1,000 organic sessions.” That forecast is the whole point of the dashboard.
Ninety Days With the Rebuilt Dashboard
The Reddit poster’s question was about a single data point—organic versus paid conversion rates. But the conversation it sparked points to a structural problem in how small businesses measure SEO everywhere, including the Philippines.
When you strip a dashboard down to five revenue-connected KPIs, segment by intent, and wire keyword clusters to actual peso figures, the reports change in tone. Instead of “organic traffic grew 23% this month,” the dashboard says “the women’s sneakers cluster generated ₱187,000 in attributed revenue, up from ₱142,000, driven by a 1.4-point conversion rate improvement on three product pages.” One of those statements is a vanity metric. The other is a business case for increasing SEO investment.
The 90-day mark matters because that’s roughly how long it takes for organic changes—new content, technical fixes, Core Web Vitals improvements—to show up in revenue data. Before that, you’re still measuring inputs. After it, the dashboard starts to function as a forecasting tool.
Three patterns we consistently see at the 90-day mark with Philippine SMBs who rebuild their dashboards this way:
First, the CEO stops asking “is SEO working?” because the answer is visible in pesos. Second, keyword clusters with high traffic but zero revenue get deprioritized, freeing budget for terms that actually convert. Third, the marketing team starts building strategy around revenue data instead of ranking positions, which changes everything about content planning and technical prioritization.
The dashboard that predicts revenue isn’t a different tool than the one you have now. It’s the same GA4 data, the same Search Console feed, the same Looker Studio template. The difference is in what you choose to surface and what you choose to bury. Five metrics, intent segmentation, and a monthly revenue reconciliation. That’s the entire architecture. The hard part was never technical—it was admitting that the old dashboard, with all its green arrows and climbing charts, wasn’t answering the only question that mattered.