The SEO Visibility Debugging Framework: A Systematic Troubleshooting Playbook for Enterprise Sites Losing Organic Traffic
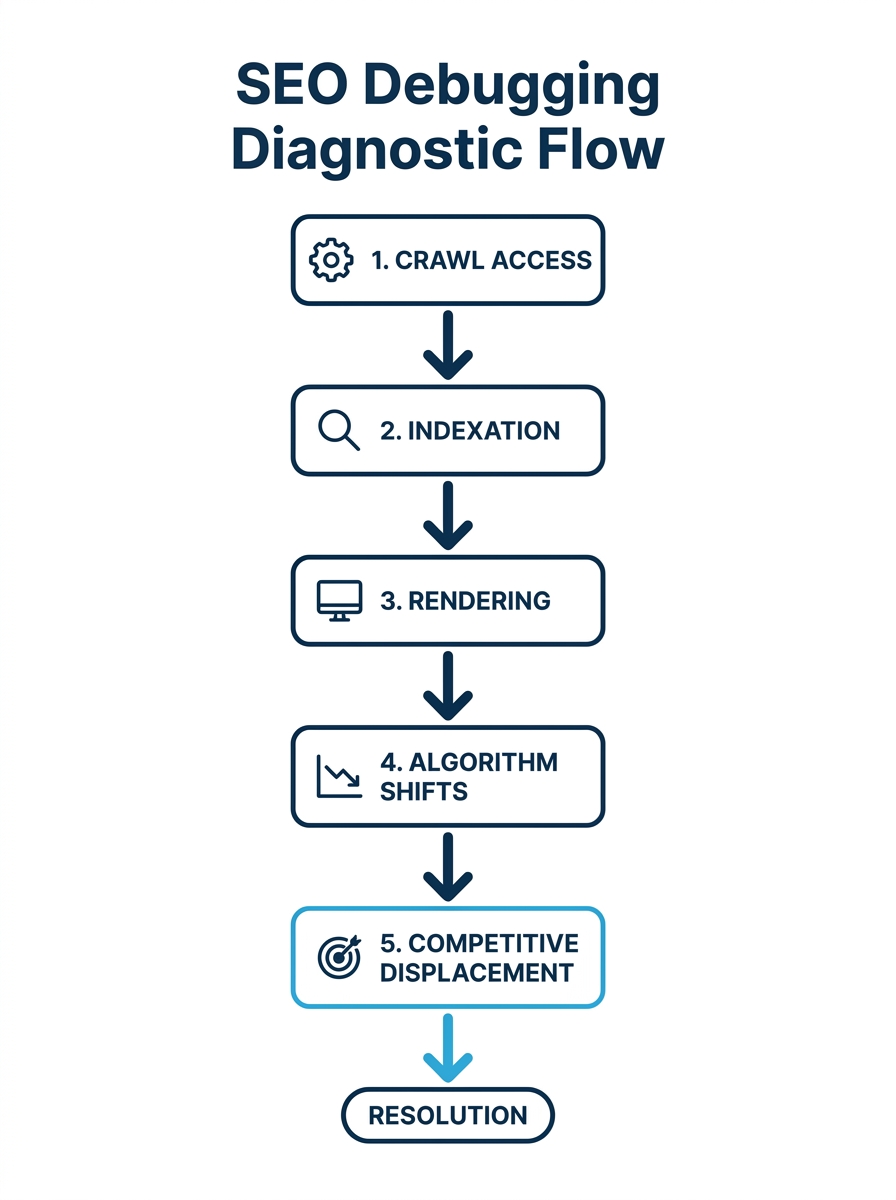
Seer Interactive’s diagnostic framework documents 19 distinct causes of organic traffic decline. For enterprise sites managing 100,000+ URLs, those causes cluster into five layers you check in sequence: crawl access, indexation, rendering, algorithm shifts, and competitive displacement. Skipping ahead wastes weeks and budget.
The Drop Surfaces in Search Console
Every organic visibility collapse diagnosis starts the same way: someone notices the graph going down. Google Search Console’s Performance report shows impressions, clicks, and average position over selectable date ranges. The first job is to figure out whether the drop is real, seasonal, or an artifact of reporting lag.
Pull 16 months of data, not the default 3. Sixteen months gives you year-over-year comparison for the same week. A 30% impression decline that coincides with the same dip from the prior year is seasonal. A 30% decline with no historical precedent is a real problem.
Check the date the decline started. Write it down. You’ll cross-reference that date against every diagnostic layer from here forward. Google’s crawl budget documentation flags that even server capacity problems (showing as “Hostload exceeded” in the URL Inspection tool) can suppress crawling across an entire domain. A single infrastructure event on a specific date can cascade into weeks of reduced visibility.
Info: Google Search Console data has a 2-3 day reporting delay. If you’re diagnosing a drop that happened within the past 48 hours, you may be looking at incomplete data. Wait for the lag to clear before drawing conclusions.
Brand vs. Non-Brand Segmentation
SEO Clarity’s traffic loss analysis methodology emphasizes that “segmenting traffic by brand vs. non-brand queries is essential for diagnosing the root cause of a decline.” This is the step most teams rush past. Brand and non-brand traffic decline for completely different reasons, and the fixes don’t overlap.
If brand traffic dropped, the problem is upstream of SEO. Reduced ad spend, PR incidents, or a competitor bidding on your brand terms in paid search are common culprits. You won’t fix this with technical SEO troubleshooting framework adjustments.
If non-brand traffic dropped, you’re dealing with an SEO-specific issue. Filter Search Console by queries that don’t contain your brand name, your product names, or common misspellings. The gap between total traffic and brand traffic is your non-brand baseline.
Run this segmentation across 3 timeframes: the 7 days before the drop, the 7 days after, and the same 7-day window from the prior year. Three comparison windows prevent you from mistaking a seasonal brand query spike (like a holiday campaign) for an SEO recovery.
Within non-brand traffic, go one level deeper. Group queries by intent category: informational, transactional, navigational. If transactional queries held steady but informational queries cratered, the likely cause is content-layer or SERP-feature displacement, including AI Overviews cannibalizing click-through rates on informational queries. If transactional queries dropped, you’re more likely facing a technical or indexation problem on your money pages.
Following the Crawl Logs
Server log analysis is where enterprise SEO debugging diverges from small-site diagnostics. On a 200,000-page e-commerce site, Googlebot may request 50,000 to 80,000 URLs per day. But which 50,000? Crawl budget audits answer that question by comparing what Googlebot actually crawled against what you wanted it to crawl.
ALM Corp’s enterprise crawl budget framework identifies six core diagnostic tools for this layer: log analysis, internal linking review, canonical audits, sitemap validation, rendering checks, and URL governance. Each tackles a different failure mode.
Pull 30 days of server logs. Filter for Googlebot’s verified IP ranges (don’t trust user-agent strings alone; spoof bots pollute the data). Map every Googlebot request against your URL taxonomy. You want to answer 4 questions:
- What percentage of revenue-generating URLs received at least 1 Googlebot hit in the past 30 days?
- What percentage of Googlebot’s total requests went to non-indexable URLs (pagination, filtered views, internal search results, expired promo pages)?
- Did the crawl rate drop on or near the date you identified in Search Console?
- Are response times for Googlebot requests averaging above 500ms?
If more than 40% of Googlebot’s requests target non-revenue URLs, you have a crawl budget waste problem that directly suppresses discovery of new and updated content. Search Engine Land reported that “improving internal linking, fixing page depth issues, and updating sitemaps to include only indexable URLs” yields measurable gains in crawl efficiency, particularly as AI retrieval systems increase the competitive pressure on crawl prioritization.
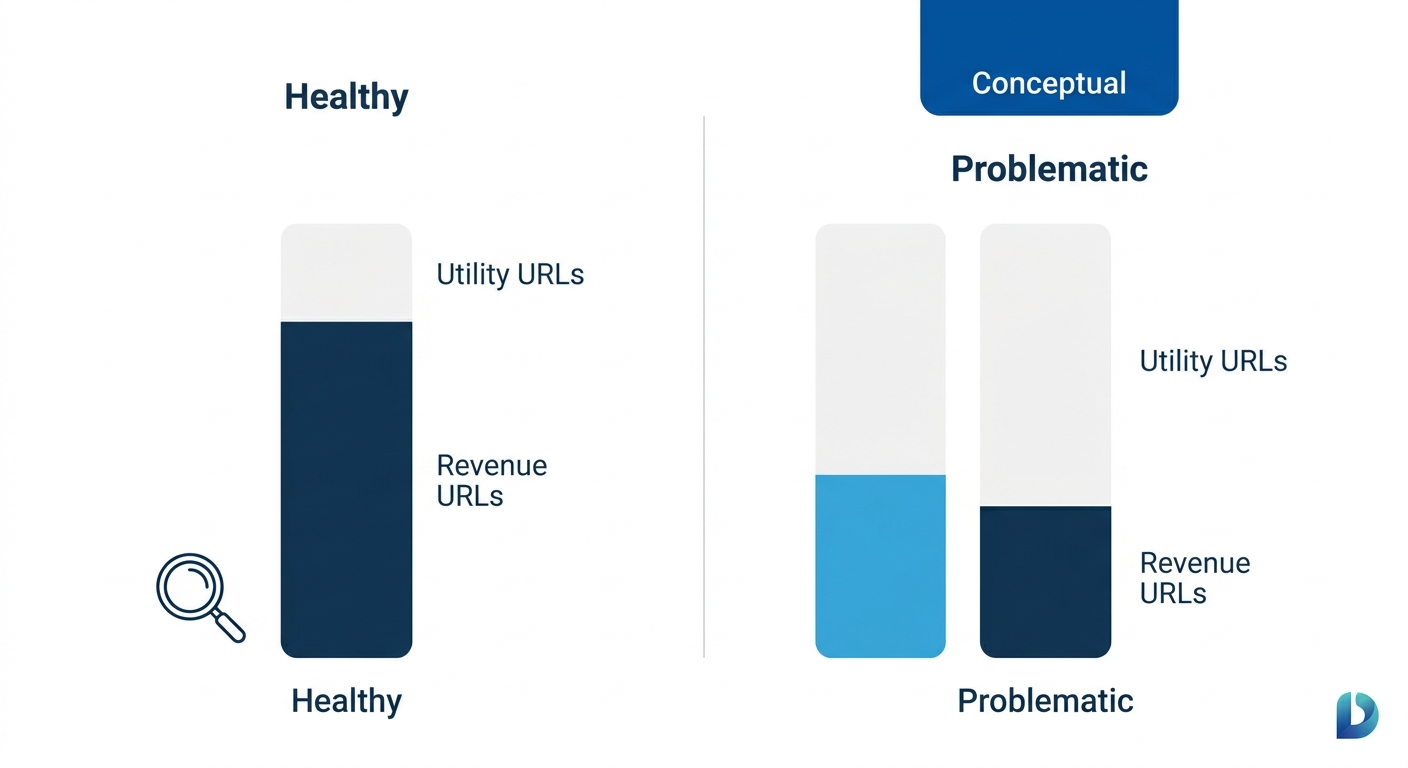
The crawl budget prioritization matrix we’ve written about previously gives you a scoring method for triaging which URLs to block, consolidate, or canonicalize. The goal is routing Googlebot’s finite attention toward pages that generate revenue.
What Google Rendered vs. What You Published
JavaScript rendering failures are invisible in traditional crawl audits. Google’s rendering pipeline processes JavaScript with a delay (the “render queue”), and pages that rely on client-side JS to load primary content face 2 distinct risks: delayed indexation and partial rendering.
Check the URL Inspection tool in Search Console for 10-15 representative pages across your site’s template types. Compare the “Rendered HTML” screenshot against what a browser displays. If primary content (product descriptions, pricing, H1 tags, internal links) is missing from the rendered version, Google can’t index what it can’t see.
DebugBear’s 2026 review of enterprise SEO monitoring tools identifies Lumar (formerly DeepCrawl) as a platform specifically built for monitoring rendering and structural SEO issues at scale. For sites running React, Angular, or Vue frameworks across thousands of templates, automated rendering validation catches failures that manual spot-checks miss.
If primary content is missing from Google’s rendered HTML version of your page, no amount of link building or content optimization will recover that page’s rankings.
Keyword cannibalization belongs in this phase, too. JetOctopus notes that cannibalization occurs when multiple pages target the same keyword, and Google picks the wrong one to rank. On enterprise sites with 6 or 7 years of content production, you may find 4 or 5 blog posts competing with a core category page for the same transactional term. The fix is consolidation, not creation, and we’ve covered how high-volume publishing can actually degrade enterprise SEO performance when it creates internal competition.
Algorithm Updates and Manual Actions
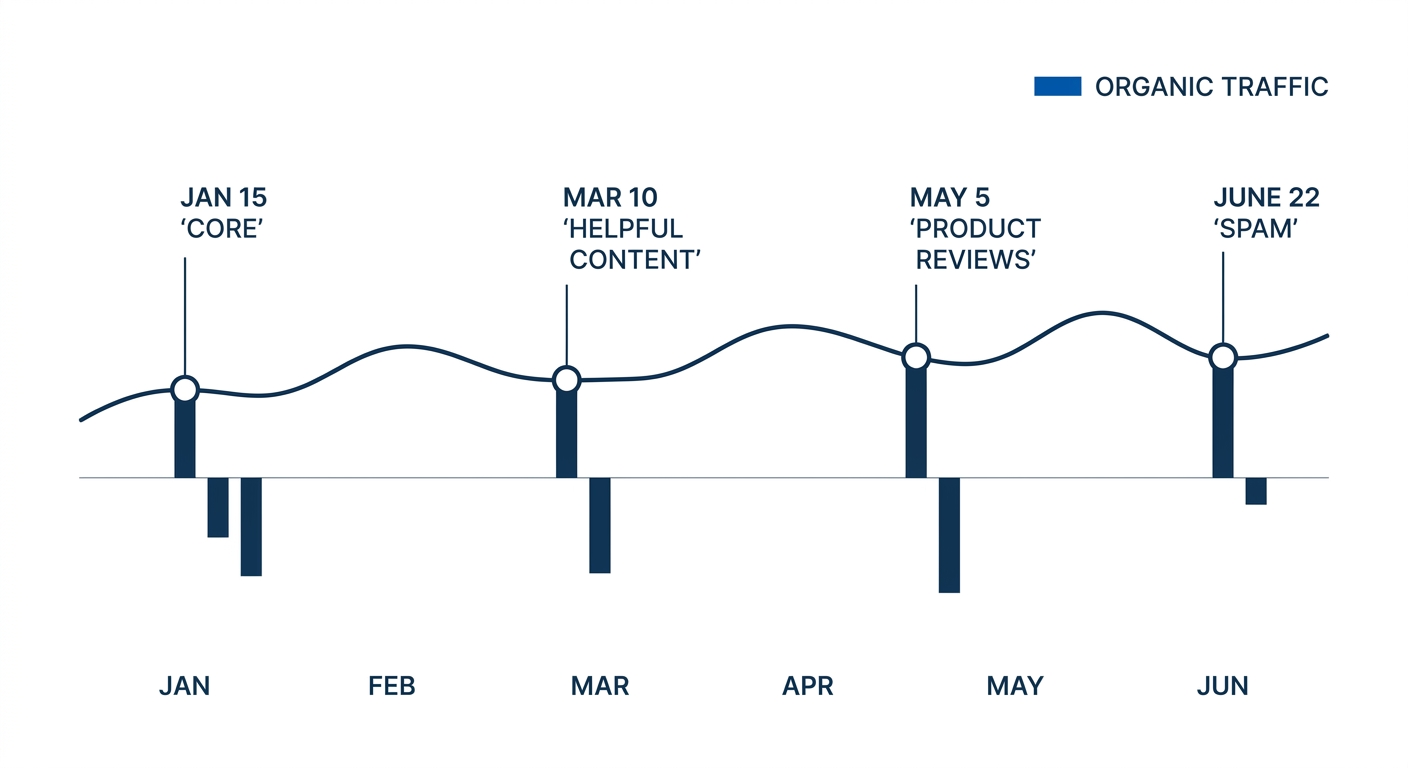
If crawl access, indexation, and rendering all check out clean, the cause is external. Google’s core algorithm updates and spam policy changes reshape ranking signals multiple times per year. Cross-reference your traffic drop date against Google’s documented update history.
The June 2026 spam update, for example, extended enforcement to AI-generated content manipulation, catching sites that had previously used AI-generated answers to inflate topical authority. If your drop date aligns with a confirmed update rollout window (typically 2-4 weeks), the update is your primary suspect.
Check Search Console’s Manual Actions report and Security Issues report. Manual actions are rare on enterprise sites, but they happen. A single compromised subdirectory injecting spam pages can trigger a site-wide manual action that suppresses the entire domain’s visibility.
For algorithm-driven drops, the diagnosis shifts from technical to qualitative. Pull the top 20 URLs that lost the most impressions. Evaluate each one against the pages that now rank where you used to. Are they more recent? More detailed? Do they carry stronger E-E-A-T signals (author credentials, original data, cited sources)? The gap between your page and the new winner tells you what the update rewarded.
Assembling the SEO Monitoring Stack
The whole point of a technical SEO troubleshooting framework is preventing the next fire, not just diagnosing this one. An SEO monitoring stack setup for enterprise sites covers 4 layers of alerting.
Gartner’s 2026 enterprise SEO platform reviews highlight that Raven Tools serves as a consolidated monitoring and reporting platform, while the BrightEdge/Conductor tier handles forecasting and performance measurement across multi-market organizations. The technical crawl layer runs on Botify or Lumar, depending on your site’s JS complexity and your team’s workflow preferences.
| Layer | What It Monitors | Example Tools | Alert Triggers |
|---|---|---|---|
| Crawl Health | Googlebot activity, response codes, crawl rate | Lumar, Botify, Screaming Frog | Crawl rate drop >20% week-over-week |
| Indexation | Pages indexed vs. submitted, coverage errors | Google Search Console, Lumar | Indexed page count drops >5% in 7 days |
| Ranking | Keyword positions, SERP feature changes | BrightEdge, Conductor, Raven Tools | Top-50 keyword losses exceed 15% of tracked set |
| Performance | Core Web Vitals, server response time | DebugBear, PageSpeed Insights | LCP exceeds 2.5s on >10% of page templates |
The layered approach matters because a single-tool setup creates blind spots. Search Console won’t tell you about crawl budget waste. Rank trackers won’t tell you about rendering failures. And crawl tools won’t flag algorithm-driven displacement. Each tool covers a distinct failure mode in your site architecture monitoring.
Tip: Set up weekly automated exports from each monitoring layer into a shared dashboard. When the next traffic drop happens, your team can cross-reference the drop date against all 4 layers in under 15 minutes instead of spending 3 days pulling reports.
ClickRank’s forensic SEO framework defines traffic loss diagnosis as “the structured process of identifying the real cause behind a decline in organic search traffic before taking corrective action.” The emphasis on “before taking corrective action” is deliberate. Enterprise teams that skip diagnosis and jump to content production, link building, or site redesigns often compound the original problem. Fix the root cause first.
Where the Data Lands Now
Enterprise sites running this five-layer diagnostic sequence consistently identify the root cause within 5-10 business days. The sequence is rigid on purpose. Crawl access comes before indexation, which comes before rendering, which comes before algorithm analysis, which comes before competitive benchmarking. Each layer depends on the previous one being clean.
The 19 causes Seer Interactive documents collapse, in practice, into the 5 layers described here. Some enterprise teams will find the problem at layer 1 (a staging robots.txt directive that leaked to production). Others will get all the way to layer 5 and realize they’ve been out-published by a competitor with better E-E-A-T signals over 8 months. Both outcomes are valid. The framework’s value is in eliminating wasted effort along the way.
And the monitoring stack isn’t optional. Sites that diagnose a drop reactively spend 3-6 weeks in triage mode. Sites with active alerting across all 4 monitoring layers catch the signal within days, often before the traffic loss compounds into revenue impact. The gap between those two response times is the difference between a blip and a quarter-defining problem. For teams evaluating how to structure this work with an agency partner, the SEO debugging pyramid provides a complementary view of how severity tiers map to escalation paths within a shared engagement model.