The SEO Debugging Pyramid: A Systematic Framework for Diagnosing Organic Visibility Collapse in Enterprise Sites
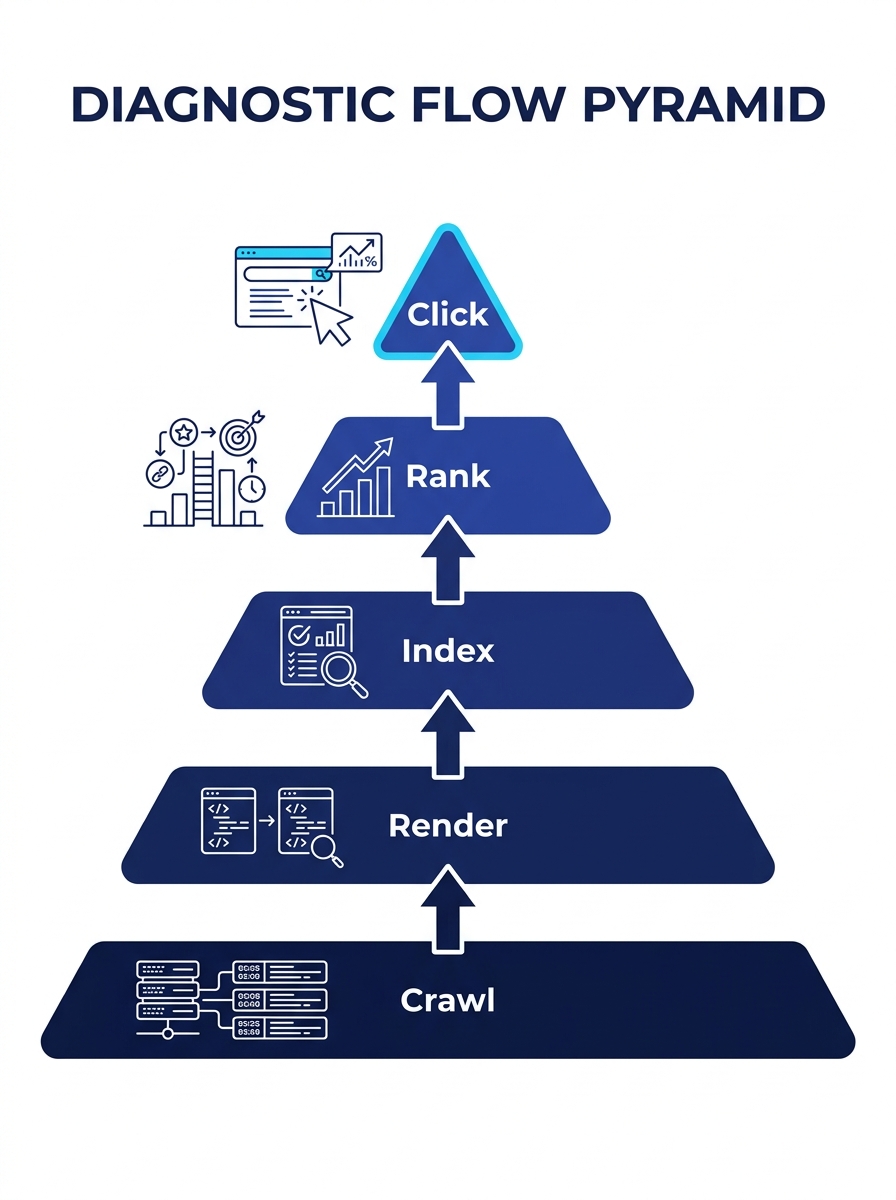
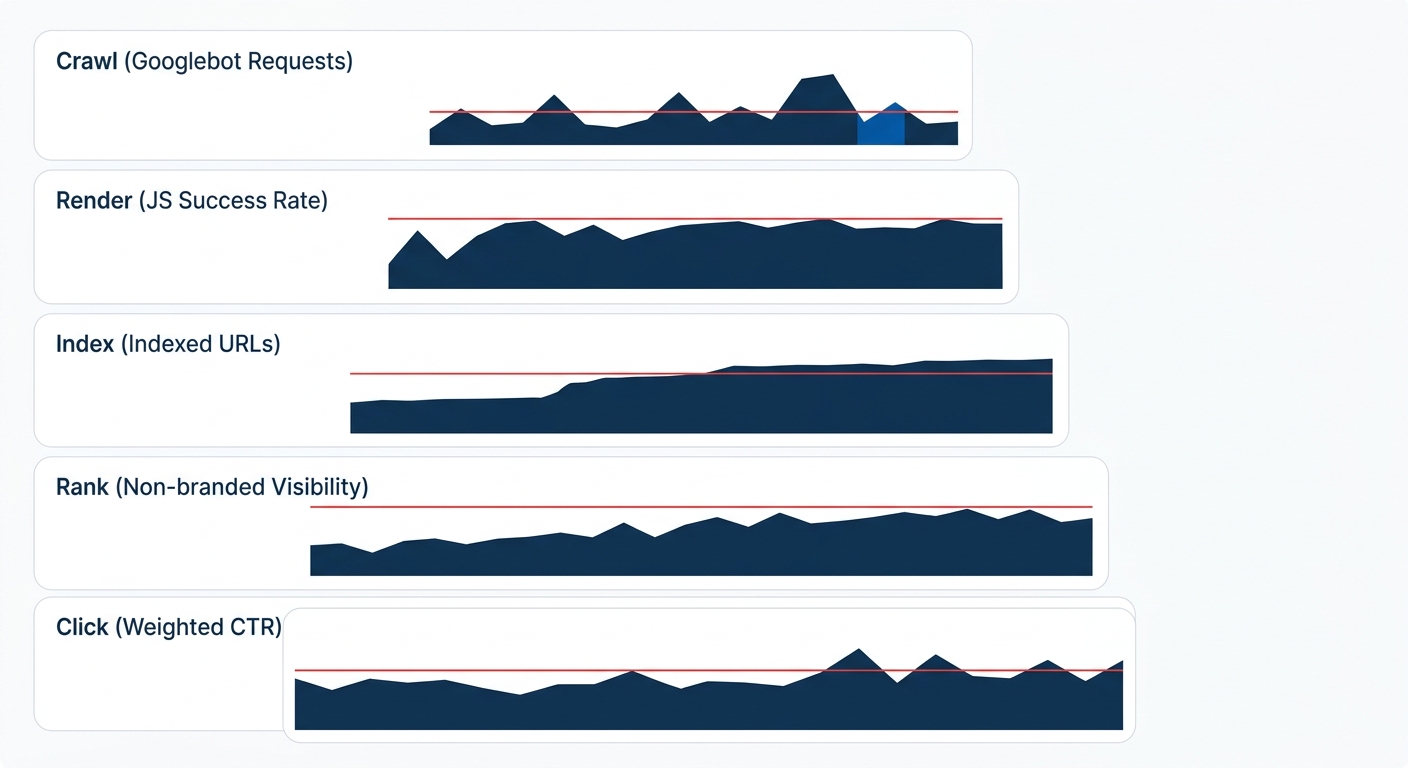
Organic visibility collapse on enterprise sites almost always originates at the crawl or render layer. The typical response—rewriting content, building links, adjusting keywords—targets ranking signals three layers above the actual failure. The SEO Debugging Pyramid enforces a strict bottom-up diagnostic order: Crawl → Render → Index → Rank → Click.
TL;DR: When organic traffic drops on a large site, diagnose from the bottom up: confirm crawl access first, then rendering, then indexation, then ranking signals, then click behavior. Skipping layers wastes weeks on fixes that can’t take effect because a lower layer is broken.
The framework corrects a specific and expensive habit in enterprise SEO troubleshooting: teams start debugging wherever the symptom is most visible. Rankings dropped? Rewrite the page. Traffic disappeared? Assume a penalty. No rich results? Fix the schema. As Search Engine Land’s practical debugging guide documents, a single robots.txt error can block entire site sections, a misconfigured canonical can trigger large-scale duplication, and rendering failures can prevent search engines from seeing content at all. Each of these lower-layer failures produces symptoms that look like upper-layer problems. The pyramid forces you to rule out the foundation before climbing.
Layer 1: Crawl Access
If Googlebot can’t reach a page, nothing above this layer matters. Crawl access is the foundation of any technical SEO diagnosis framework, and it’s the layer most often assumed to be working when it isn’t.
For sites with 50,000+ URLs, Google’s crawl budget documentation defines crawl budget as the number of URLs Googlebot will fetch within a given timeframe, adjusted dynamically based on server health and perceived site value. A million-page site might see Googlebot crawl roughly 500,000 pages per day. But if 80% of that budget gets consumed by faceted navigation, parameter variations, or staging URLs, your revenue-generating pages get crawled on a cycle measured in weeks rather than hours.
Server log analysis is the diagnostic tool here, and nothing else substitutes for it. Search Console’s crawl stats report shows aggregate patterns, but logs reveal ground truth: which specific URLs Googlebot requested, what status codes your server returned, and how response times varied across the crawl. We’ve written extensively about how non-revenue URLs consume crawl budget on enterprise sites, and the pattern repeats across industries. Internal search result pages, expired promo landing pages, infinite calendar widgets: these create spider traps where the crawler follows an effectively infinite loop of parameterized URLs and never reaches the pages that generate revenue.
The diagnostic checklist at this layer is direct. Pull 30 days of server logs, filter for Googlebot (verified by reverse DNS), and answer three questions. Are your priority URLs being crawled at all? What percentage of crawl requests go to URLs you actually want indexed? Are response times consistently under 500 milliseconds? If any answer is wrong, stop here. Fixing content or links while crawl access is broken produces zero measurable change.
Warning: A robots.txt file that accidentally disallows a critical directory after a site migration or CMS update can silently block thousands of pages. This is the single fastest visibility killer on enterprise sites, and it won’t surface in ranking tools because those pages were never evaluated for ranking at all.
Layer 2: Rendering
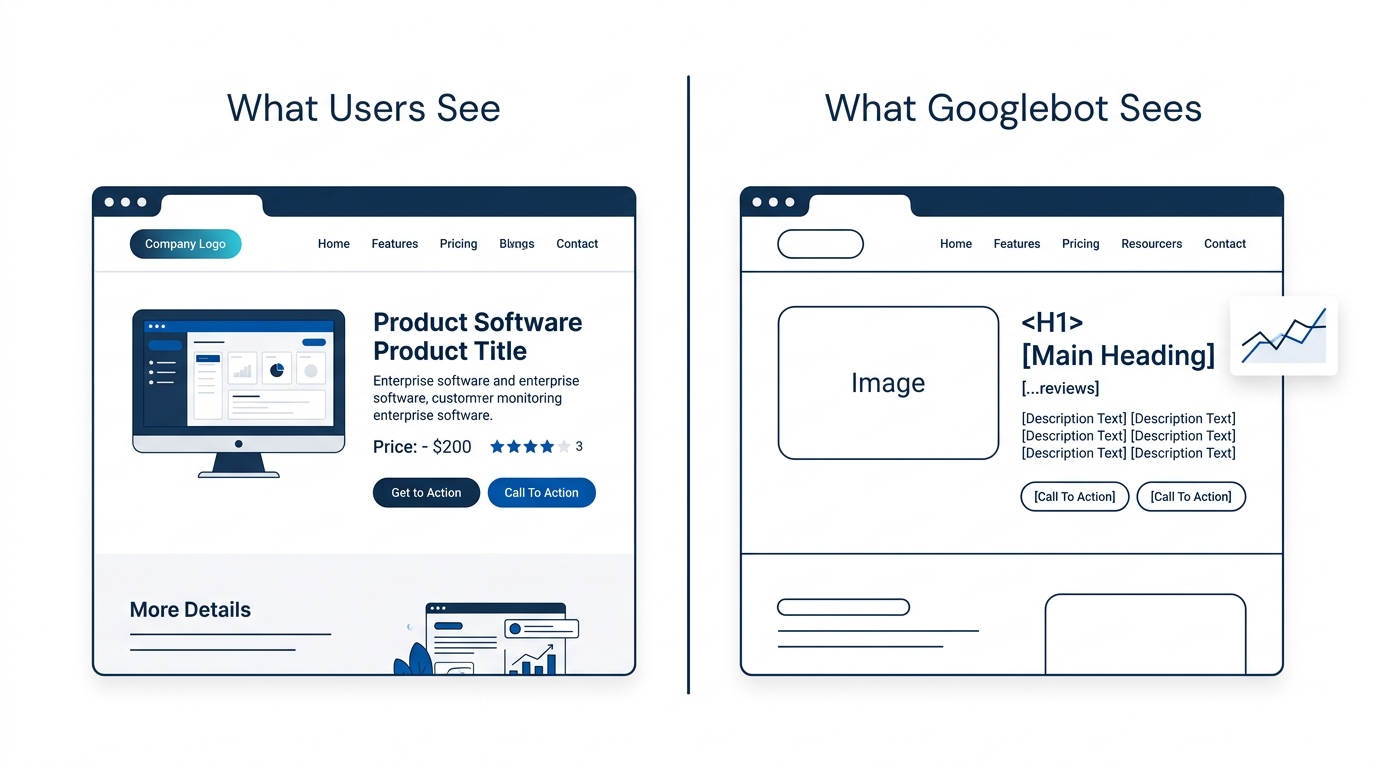
Google’s December 2025 rendering update confirmed that pages returning non-200 status codes may be excluded from the rendering pipeline entirely. This matters because modern enterprise sites increasingly rely on JavaScript frameworks where the initial HTML contains little indexable content. If Google can’t render the page, it indexes the raw HTML shell, which often contains nothing useful.
Why does rendering break at the enterprise level? Because development teams optimize for user experience in a browser, and Googlebot’s renderer operates under different constraints. JavaScript that depends on user interaction to load content, client-side API calls that time out during server-side rendering, and third-party script dependencies that block the DOM all produce pages that look complete to a human testing in Chrome but appear empty to the crawler. Enterprise SEO tools with JavaScript rendering support, like Lumar, help teams audit these discrepancies at scale. According to SEOTesting’s analysis of enterprise SEO platforms, governance and compliance features in these tools enforce technical SEO standards across teams and regions, which is critical when multiple development squads work on the same codebase and any deployment can introduce rendering regressions.
The diagnostic at this layer requires comparing what Googlebot sees against what a browser sees. Google Search Console’s URL Inspection tool provides a rendered screenshot for individual URLs, but for enterprise-scale site architectures, you need programmatic comparison across page templates. A rendering failure on one product detail page usually means a rendering failure on every page built from that template, affecting thousands of URLs simultaneously.
Interaction to Next Paint (INP) replaced First Input Delay (FID) as a Core Web Vitals ranking signal, which means rendering performance now affects both crawlability and ranking. A page that renders correctly but takes 4 seconds of JavaScript execution to become interactive fails at two pyramid layers simultaneously.
Layer 3: Indexation
A page that gets crawled and rendered correctly still might not appear in Google’s index. The indexation layer is where Google decides whether your page is worth storing, and on enterprise sites with hundreds of thousands of URLs, this decision affects a material share of the catalog.
Search Console’s Index Coverage report is the primary diagnostic tool. Filter by “Crawled – currently not indexed” and “Discovered – currently not indexed” to identify pages Google found but chose not to index. Common causes at the enterprise level include thin content across product or location pages, duplicate content triggered by misconfigured canonicals, and content parity issues where multiple URLs serve near-identical information.
Canonicalization errors deserve specific attention because they’re easy to introduce and hard to detect at scale. A site migration that maps old URLs to new ones but leaves canonical tags pointing to the old domain creates a scenario where Google sees every page as a duplicate of a page that no longer exists. The result looks like a ranking collapse, but the actual failure is at the index layer. Google simply stopped storing those pages.
Keyword cannibalization also sits here. When 12 product pages and 3 blog posts all target the same keyword cluster, Google picks one (often the wrong one) and suppresses the rest. The symptom appears as a ranking problem, but the root cause is an indexation decision driven by content overlap. Brands that have mapped their content to clear authority territories before the overlap emerges avoid this problem; brands that haven’t end up playing whack-a-mole with page-level optimizations that never stick.
Layer 4: Ranking Signals
Only after confirming that pages are crawled, rendered, and indexed does ranking signal analysis become productive. This is where most enterprise SEO troubleshooting begins and where it wastes the most time when lower layers are broken.
Ranking signals include on-page factors (content relevance, heading structure, entity coverage), authority signals (backlink profile, domain trust, topical authority), and technical signals (page speed, mobile usability, structured data). A meaningful drop in non-branded organic traffic with stable branded traffic typically indicates a ranking signal problem, because brand queries are less sensitive to algorithmic shifts.
The diagnostic starts with segmentation. Break traffic by directory, device type, and query type (branded vs. non-branded). If non-branded traffic collapsed across all directories simultaneously, the cause is likely algorithmic. The May 2026 core update, for instance, triggered significant visibility redistribution across enterprise sites for a two-week window. If the collapse is isolated to specific directories or page templates, the problem is more likely structural: a template change that removed internal links, stripped heading hierarchy, or altered content depth.
Strategic internal linking from existing pages accelerates both indexing and ranking recovery. One retail brand case study documented a 23% rise in organic traffic from adding internal links to underperforming product pages with no other changes. We’ve covered how internal linking architecture compounds organic growth over multi-quarter windows, and the principle applies directly to recovery scenarios where existing page equity is being stranded by poor link structure.
A ranking collapse with stable crawl, render, and index metrics is a content or authority problem. A ranking collapse with broken lower layers is a misdiagnosis waiting to happen.
Layer 5: Click Behavior
The top of the pyramid addresses what happens after Google ranks your page: whether users actually click on it. A page holding positions 3-5 for high-volume queries can still deliver minimal traffic if the SERP is dominated by AI Overviews, featured snippets, or rich results that satisfy the query without a click.
CTR diagnosis requires Search Console’s Performance report filtered by query and page. Compare your CTR against position-expected baselines: position 1 historically delivers 25-30% CTR for informational queries, but that figure drops below 15% when AI Overviews occupy the top of the SERP. The rise of AI-driven search interfaces and answer engines means that organic visibility recovery now requires evaluating whether the click opportunity still exists for a given query, or whether the SERP has structurally changed to reduce click volume regardless of ranking position.
Title tags and meta descriptions matter at this layer, but they’re surface-level fixes. The deeper diagnostic question is whether your page type matches the intent Google is serving. If Google shows product carousels for a query and you’re ranking a blog post, no title tag optimization will close the CTR gap. The fix lives at the content strategy level, and that’s where working with an enterprise SEO program or content strategy and production partner becomes the difference between incremental tinkering and structural realignment.
Building the SEO Monitoring Stack That Catches Failures Early
Each pyramid layer requires different instrumentation, and relying on a single tool creates blind spots across every level. The table below maps each layer to its diagnostic tools and the key metric that triggers investigation:
| Pyramid Layer | Primary Tool | Secondary Tool | Key Alert Metric |
|---|---|---|---|
| Crawl | Server log analyzer (Screaming Frog Log Analyzer, Logflare) | Search Console Crawl Stats | Crawl frequency per priority URL, 5xx error rate |
| Render | Lumar or Sitebulb with JS rendering | Search Console URL Inspection | DOM content match rate, render error count |
| Index | Search Console Index Coverage | Site: search operator spot checks | Indexed-to-submitted URL ratio |
| Rank | SEOTesting, Semrush, or Ahrefs | Search Console Performance (query-level) | Non-branded visibility score, position distribution |
| Click | Search Console Performance (page-level) | Third-party SERP feature tracker | CTR vs. position-expected baseline |
The critical gap in most enterprise SEO monitoring stacks is the absence of server log analysis. Teams track rankings and traffic daily but have no visibility into whether Googlebot’s crawl behavior changed three days before the traffic drop. By the time the ranking tool registers a decline, the crawl-layer failure has been compounding for 72-96 hours. A well-configured monitoring stack alerts on crawl anomalies (sudden spikes in 5xx responses, drops in crawl frequency for priority directories) within hours, giving teams a window to fix or roll back changes before the damage propagates up the pyramid.
Where the Model Breaks
The pyramid assumes a clean separation between layers, and real enterprise sites don’t always cooperate. A JavaScript rendering failure can produce partial indexation where Google indexes the HTML shell, which contains enough content to rank (poorly) but not enough to rank well. The symptom appears at Layer 4, the cause lives at Layer 2, but there’s enough signal at Layer 3 to convince a team they’ve confirmed indexation and should move upward. These bleed-through failures are the hardest to catch because each layer appears to pass a cursory check.
Algorithm updates introduce another complication. Google’s core updates can change how content quality is evaluated, how link signals are weighted, and how SERP features are allocated, all simultaneously. A core update can make a site that was crawled, rendered, indexed, and ranking well suddenly lose visibility because the ranking criteria shifted underneath it. The pyramid helps you confirm the lower layers are intact before assuming the update is the cause, but it can’t tell you which ranking signals the update changed.
The model also has a scope limitation: it diagnoses one page type at a time. Enterprise sites with 200,000+ URLs and 15+ distinct page templates need to run the pyramid against each template independently. A product detail page template might have a rendering problem while category pages have a cannibalization problem and blog content has a click-through problem. Running the pyramid once at the site level misses template-specific failures that aggregate into the overall traffic decline.
Despite these edge cases, the bottom-up diagnostic order holds. Even when the layers blur, starting at crawl and working upward prevents the single most expensive mistake in organic visibility recovery: spending six weeks optimizing content on pages Google never crawled in the first place. The discipline is boring. The pyramid is simple. And that simplicity is exactly what keeps enterprise teams from chasing symptoms while the foundation crumbles beneath them.