Why Google Ads Engagement Is Up But Your Conversions Aren’t: A Performance Max Reality Check for APAC Brands

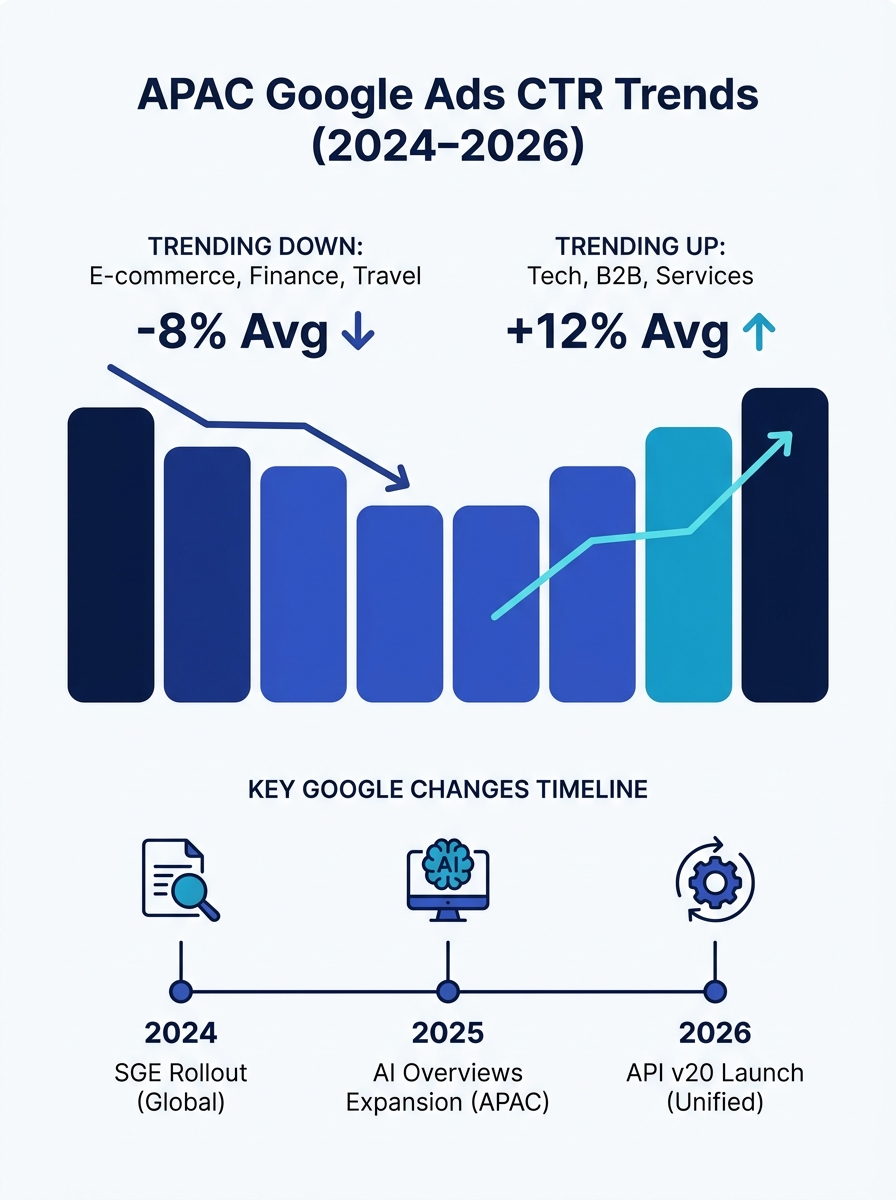
WordStream’s 2025 benchmark report measured an overall 3.74% increase in average Google Ads click-through rates across industries. That number, published as a year-over-year comparison, looks like welcome news for paid media teams in the region. But the same report reveals a split underneath: over half of the industries tracked actually saw CTR decline, while a smaller subset pulled the overall average upward. For APAC brands spending within a market forecast to reach $376.4 billion in advertising this year, the surface-level engagement gains are hiding a more uncomfortable conversation about where those clicks are actually going.
The CTR Headline vs. the Conversion Reality
Google Ads CTR trends in 2026 depend entirely on which industry vertical and campaign type you’re examining. The aggregate increase tells one story. Individual advertiser experience tells another.
One advertiser on r/PPC reported their average CTR fell from 14% to roughly 7% over the course of a year, with the steepest decline hitting around April 2024 and holding steady since. They were running Manual CPC without Broad Match, meaning algorithmic expansion wasn’t the cause. That particular thread drew dozens of replies from advertisers experiencing similar trajectories, which suggests the pattern wasn’t isolated to one account or one vertical.
WordStream’s earlier 2024 analysis attributed part of the CTR drag to Search Generative Experience (SGE, now AI Overviews), which provided detailed organic answers directly in search results. Ads appearing alongside those AI-generated responses had lower CTRs compared to ads appearing alongside traditional blue-link results. The implication is that Google Ads engagement metrics can move in opposite directions depending on how the search results page around those ads is structured, something the advertiser has zero control over.
So when your dashboard shows CTR holding steady or climbing, the question you should be asking your agency isn’t “why is engagement up?” It’s “what’s the quality profile of the traffic that’s clicking?”
APAC’s Ad Spend Growth Masks a Paid Media Efficiency Problem
The Asia Pacific region remains the fastest-growing advertising market globally, with Statista confirming the internet as the dominant medium for ad spend in APAC, surpassing television back in 2016. The directional momentum is clear: brands are spending more on digital, and a meaningful chunk of that flows through Google Ads.
But more spend doesn’t mean better outcomes. A recent report from Open Magazine documented how rising customer acquisition costs on Google and Meta are pushing brands toward affiliate-first models, with CashKaro growing 72% in FY26 specifically because the economics of paid search deteriorated for its advertiser partners. That’s an India-specific case, but the dynamic applies broadly across APAC markets where CPCs are climbing while conversion rates flatten or decline.
The Performance Max conversion gap shows up most clearly when you look at cost-per-conversion volatility. Multiple advertisers on Reddit have documented scenarios where their PMax cost per conversion spiked from the mid-teens to the fifties within days, with no corresponding competitive shift to explain it. One account reported a sudden conversion rate crash to 1.8% during a single week in mid-May that never fully recovered to prior levels.
The directional momentum is clear: APAC brands are spending more on digital. But more spend doesn’t mean better outcomes, and Performance Max is where that gap becomes hardest to explain.
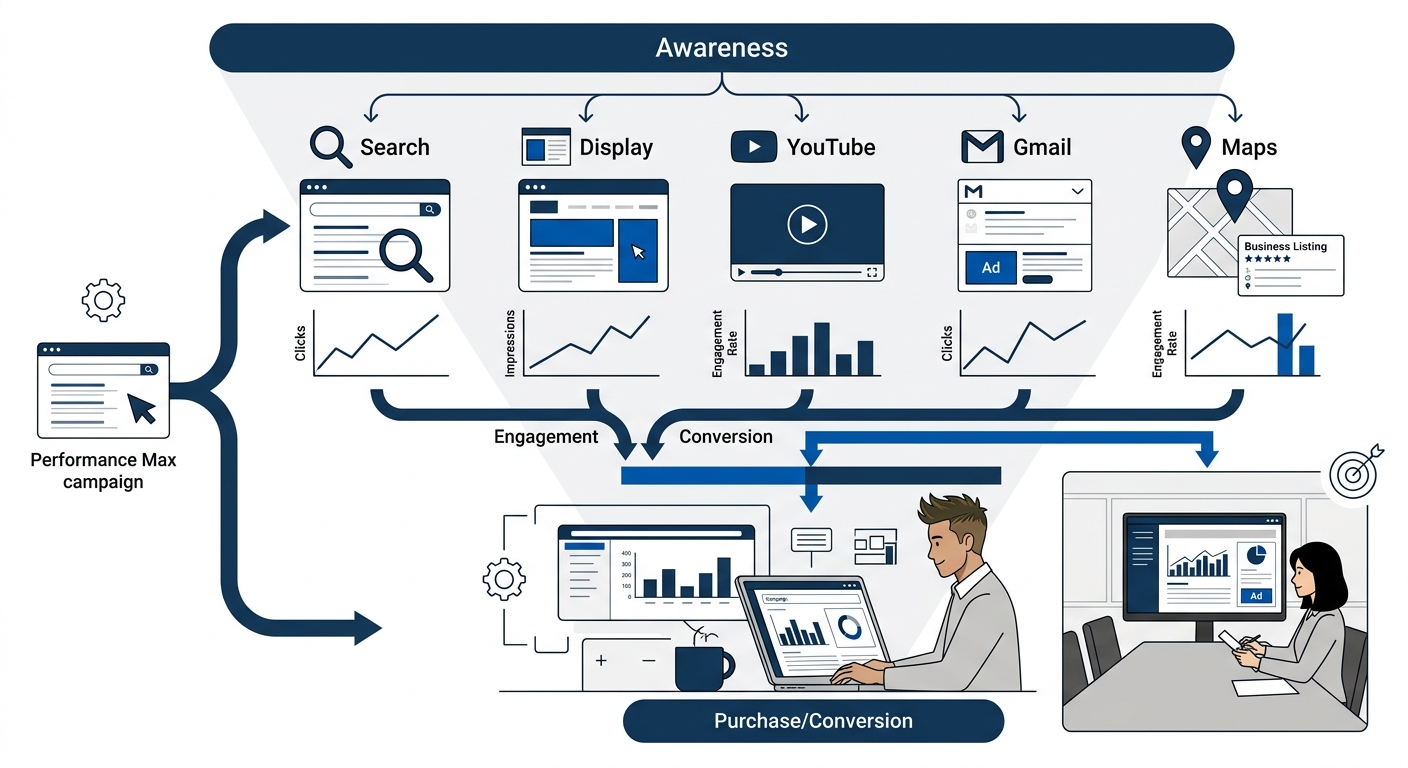
These aren’t fringe anecdotes. They reflect a structural issue with how Performance Max allocates budget across its network of Search, Display, YouTube, Discover, Gmail, and Maps placements, and how little visibility advertisers have into which placements actually generated the conversions being reported.
How Performance Max Creates the Engagement-Conversion Disconnect
Performance Max campaigns are designed to optimize for conversions across all Google inventory simultaneously. In theory, the algorithm identifies the highest-value user at the lowest cost across channels. In practice, the campaign type’s opacity makes it difficult to verify whether engagement metrics (impressions, clicks, CTR) are actually correlating with business outcomes.
There are three specific mechanisms behind the disconnect:
Broad AI-driven targeting without adequate guardrails. A PPC Land analysis from late 2025 found that AI Max, the successor to Dynamic Search Ads, generated roughly 30,000 search terms where 99% of impressions produced zero conversions. That’s the algorithm doing exactly what it was designed to do — finding long-tail queries and serving ads against them — but with no meaningful conversion signal emerging from the expanded reach. For brands evaluating paid media efficiency in APAC markets, that kind of expansion looks like engagement growth on the dashboard while doing nothing for the pipeline.
Modeled conversions inflating reported numbers. Google’s consent framework and privacy changes mean a growing share of reported conversions are modeled rather than directly observed. When your consent banner defaults to “deny” and the gtag implementation doesn’t properly update upon user acceptance, the tracking pixel fires inconsistently. Google Ads then fills in the gaps with modeled data. Your agency reports look fine. Your CRM tells a different story.
Call extensions and micro-conversions counted alongside primary conversions. Google’s Quality Score system, which operates on a 1-10 scale based on ad relevance, expected CTR, and landing page experience, rewards engagement signals. But PMax campaigns can count call asset interactions as conversions unless explicitly excluded, which inflates the conversion column without corresponding to actual sales or qualified leads.
If your internal team or agency hasn’t audited which conversion actions are feeding the PMax algorithm, you may be optimizing toward a metric that doesn’t reflect revenue.
What Google Changed in April 2026 — and What It Means for Your Reporting
Google made several updates in March and April 2026 that directly affect how brands can diagnose the engagement-conversion gap:
Search term reporting for Performance Max. The Google Ads API v20, released March 25, 2026, introduced the campaign_search_term_view report for PMax campaigns. This is a significant transparency improvement. For the first time, advertisers can see which queries triggered their PMax ads, making it possible to identify irrelevant traffic that drives clicks but produces nothing downstream. If your agency hasn’t integrated this into their reporting workflow yet, ask why.
Asset experiments in PMax. As of April 2026, Google now allows A/B testing of images, videos, and text assets directly within Performance Max campaigns. This matters because creative quality is often the variable that separates campaigns where engagement translates to conversions from campaigns where it doesn’t. An AdExchanger analysis from this past week made the point directly: brands can’t trust AI to compensate for mediocre creative through volume alone.
Dynamic Search Ads transitioning to AI Max. Google announced on April 15, 2026, that DSA campaigns will be upgraded to AI Max starting in September 2026. This consolidation expands AI-driven ad creation further, which means the guardrails you set now — campaign-level negative keywords, audience signals, conversion action definitions — will determine whether the expanded reach actually performs.
Granular data retention cut to 37 months. Starting June 2026, Google Ads is reducing granular reporting access from its previous policy to a 37-month window. For brands that rely on year-over-year comparisons to evaluate paid media efficiency, this means exporting historical data now before it becomes inaccessible.
This is relevant context for any APAC brand building a unified attribution model across paid and organic channels. The data infrastructure underneath your reporting is shifting, and the assumptions baked into last year’s dashboards may not hold.
The Tracking Audit Most APAC Brands Haven’t Done
The uncomfortable truth behind the Performance Max conversion gap is often mechanical rather than strategic. Before blaming the algorithm, brands should be asking their agencies to verify three things:
First, whether Consent Mode v2 is properly implemented. In markets across APAC where consent requirements vary by jurisdiction, a misconfigured consent banner can block conversion tracking entirely while still allowing ad serving to proceed normally. The result is a campaign that racks up clicks and reports modeled conversions while your actual form submissions or checkout completions don’t register.
Second, whether the conversion actions feeding PMax are actually primary business outcomes. If call extensions, page views, or scroll-depth events are included alongside form fills or purchases, the algorithm will optimize toward whichever conversion action is easiest to generate. The dashboard will show conversion volume. The business won’t see the revenue.
Third, whether geographic targeting matches actual business coverage. The API v20 update added MatchedLocationInterestView for AI Max campaigns, which surfaces performance data based on geographic interest signals. For Philippine brands or APAC companies targeting specific national markets, this report can reveal whether engagement is coming from your actual target audience or from users in regions where you can’t fulfill the sale.
If you’ve been tracking revenue rather than vanity metrics on the organic side of your marketing, the same discipline applies here. The Google Ads engagement metrics that look healthy on the surface need to be reconciled against what’s actually happening in your CRM.
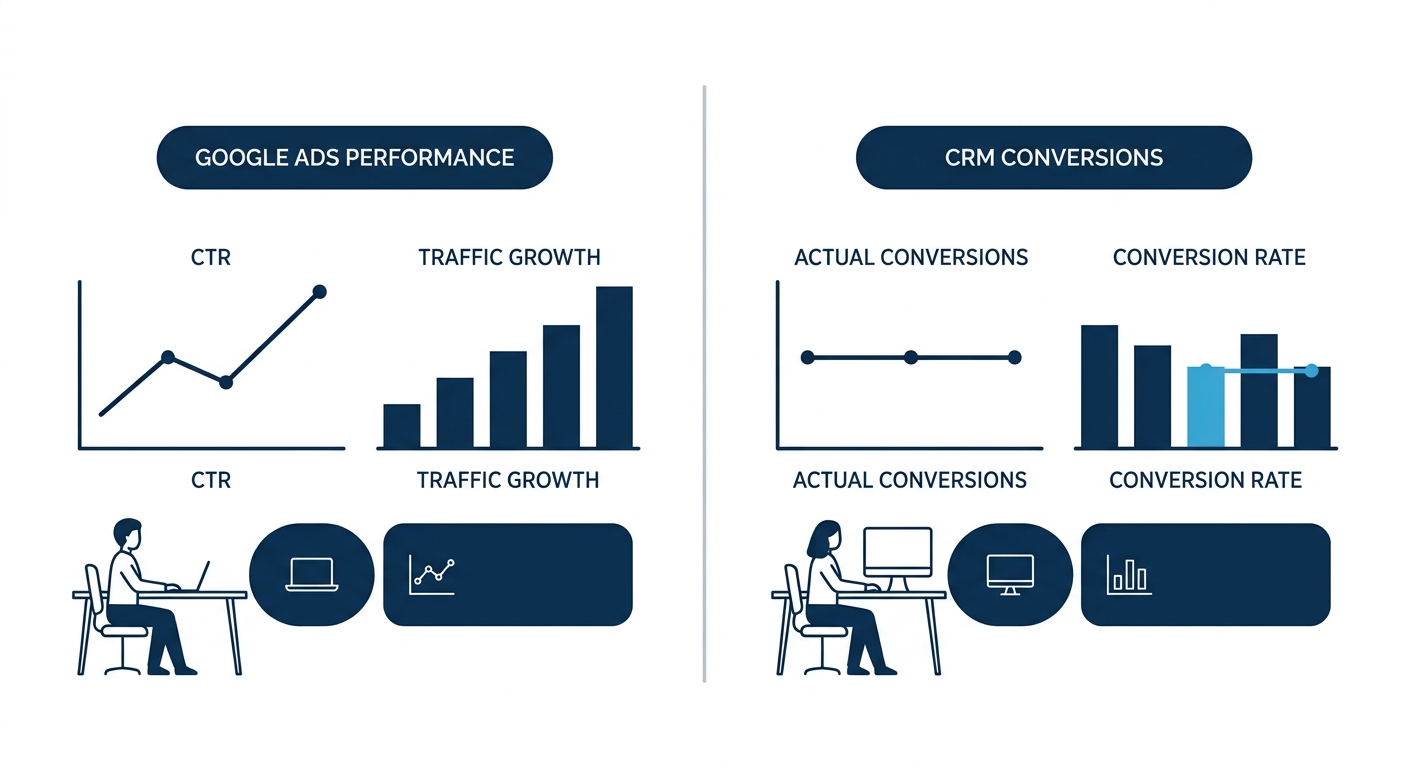
Warning: If your agency is reporting PMax conversions without cross-referencing against your CRM or analytics backend, the numbers you’re reviewing in QBRs may include modeled data, call interactions, and micro-conversions that never generated revenue.
Questions the Numbers Still Can’t Answer
The data tells us that Google Ads CTR trends in 2026 are moving in encouraging directions at the aggregate level. It tells us APAC ad spend is growing faster than any other region. It tells us Performance Max is expanding its reach through AI-driven targeting, and that Google has begun opening the black box with search term reporting and asset experiments.
What the data doesn’t tell us is whether the AI’s definition of a “high-value user” matches yours. Google’s algorithm optimizes toward the conversion actions you give it, and if those actions don’t precisely reflect your business outcomes, no amount of engagement improvement will close the gap. The new transparency tools in API v20 are a step forward, but they require active use — your team or your agency needs to build reporting around them rather than waiting for the data to surface in default views.
For APAC brands evaluating their paid media partners, the conversation has shifted. The relevant question for your next agency review isn’t whether CTR or impression share improved. It’s whether the agency has audited your conversion actions against actual revenue, implemented the new PMax search term reporting, and established a protocol for negative keyword management in a campaign type that was, until very recently, a black box. Understanding how Google Ads costs actually work in the Philippine market is a prerequisite, but the cost side only matters if the conversion side is trustworthy.
The numbers are getting better at the surface level. Whether that means anything for your business depends on how deeply you’re willing to look underneath them.