The Crawl Budget Prioritization Matrix: Auditing Enterprise Sites for Hidden Non-Revenue URLs Draining Organic Visibility

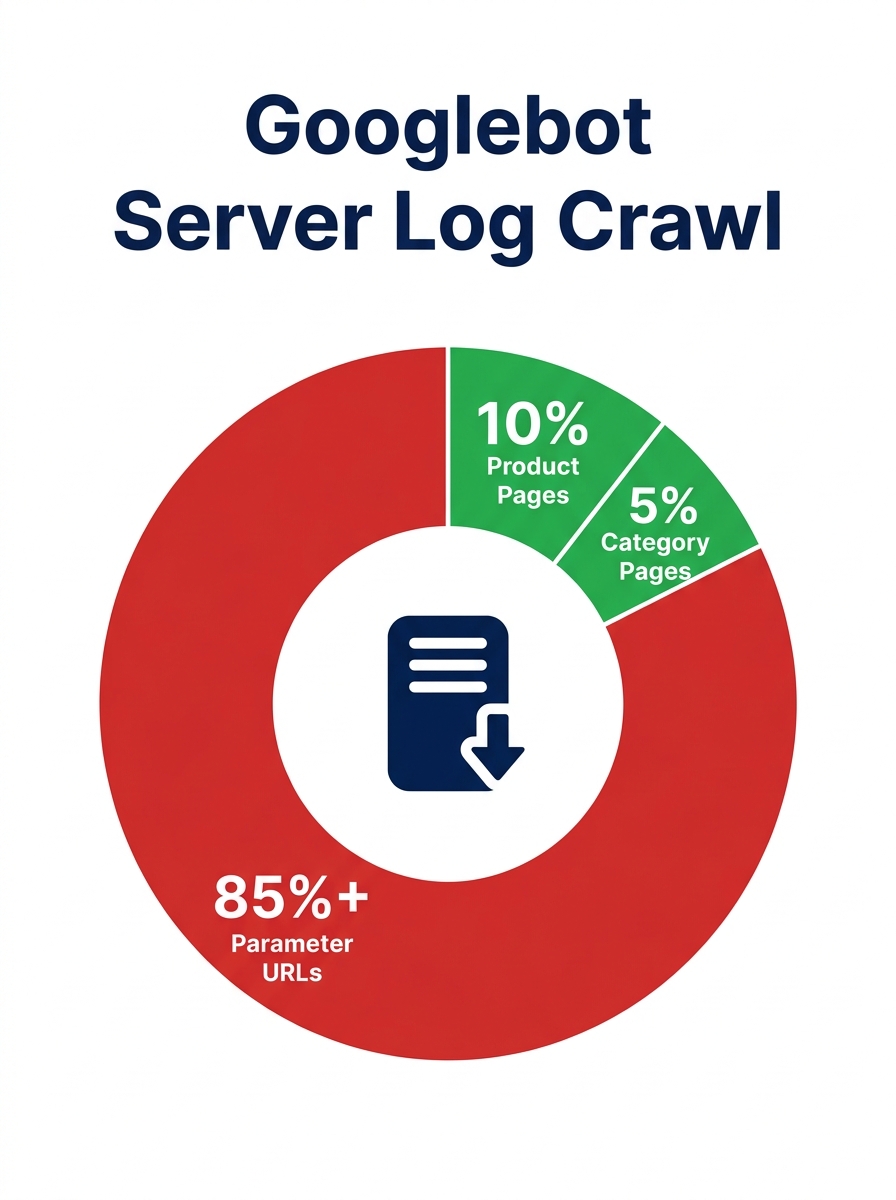
Forty-five percent of Googlebot requests on one enterprise e-commerce domain went to parameter URLs (faceted filters, sort variations, pagination chains) that produced zero organic sessions. Enterprise crawl budget audits consistently reveal these non-revenue URL clusters as the primary mechanism suppressing indexation of pages that actually drive revenue.
TL;DR: On enterprise sites with 100,000+ pages, hidden non-revenue URLs routinely consume 40–70% of Google’s crawl allocation. A structured audit using a two-axis prioritization matrix (crawl consumption × revenue contribution) identifies which URL clusters to block, prune, or consolidate so crawler attention redirects toward commercially important pages.
Why Crawl Allocation Becomes a Revenue Problem at Scale
Google allocates crawling resources per site based on quality signals, server capacity, and the specific Google product it’s indexing for, according to Google’s own crawl budget documentation. On a 500-page brochure site, this allocation barely matters. On an enterprise domain with 100,000+ indexed URLs, the allocation becomes the choke point between organic visibility and organic invisibility.
The math works against large sites by default. Every parameter URL, every internal search result page, every expired campaign landing page that remains crawlable competes for the same finite budget as product detail pages, category hubs, and service pages. When an e-commerce site generates 340,000 monthly crawl requests to filter URLs alone, that’s 340,000 requests that didn’t go to pages where a purchase or lead conversion can actually happen.
Vladimir Siedykh’s enterprise robots.txt guide puts it plainly: “Product pages that update regularly need frequent crawler attention, while static technical documentation might require crawling only when content changes.” The inverse is also true. Pages that never change and never convert shouldn’t receive crawler attention at all.
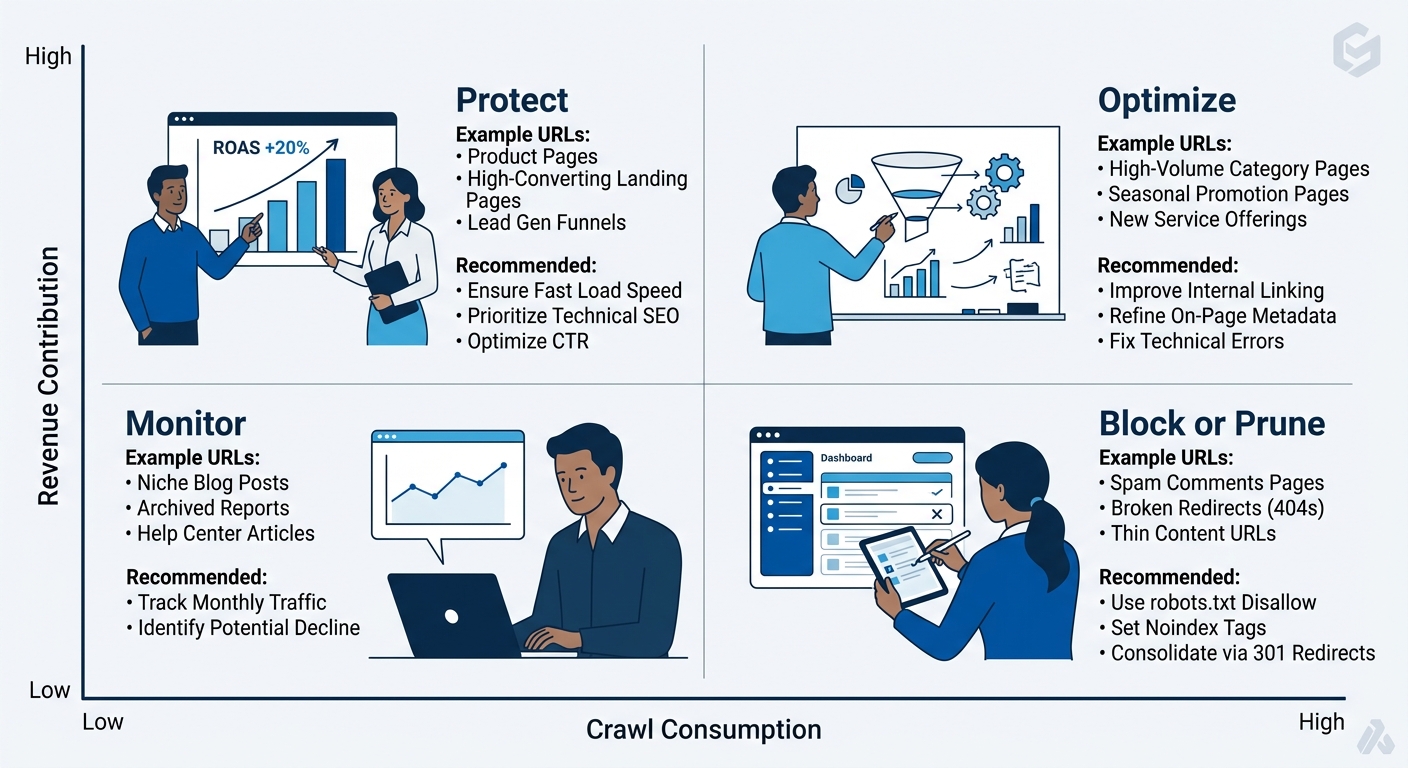
The Two-Axis Prioritization Matrix
An enterprise crawl budget audit needs a framework that ranks URL clusters by business impact, not technical severity. We propose evaluating every URL template type across two axes: crawl consumption (what percentage of Googlebot requests does this URL pattern absorb?) and revenue contribution (does this URL type generate organic sessions that lead to conversions?).
This produces four quadrants:
| Quadrant | Crawl Consumption | Revenue Contribution | Action |
|---|---|---|---|
| Protect | Low | High | Maintain or increase crawl access; ensure internal links and sitemap inclusion |
| Optimize | High | High | Reduce crawl cost through server speed and template efficiency; keep indexed |
| Monitor | Low | Low | Benign today but track for growth; review quarterly |
| Block or Prune | High | Low | Remove from index, block via robots.txt, consolidate, or return 410 status |
The “Block or Prune” quadrant is where enterprise crawl budget audits find the largest wins. URL patterns in this quadrant typically include faceted navigation filters, internal site search results, paginated archives beyond page 3, expired promotional pages, staging or preview URLs that leaked into production, and tag or author archive pages on content-heavy domains.
One documented case study showed that removing 72% of indexed URLs from this quadrant and reducing overall crawl waste by 73% produced measurable improvements in organic CTR and average position for the remaining pages. The pages that stayed in the index got crawled more frequently and indexed faster because they no longer competed with thousands of zero-value siblings.
When an e-commerce site generates 340,000 monthly crawl requests to filter URLs, that’s 340,000 requests that didn’t go to pages where a purchase or lead conversion can actually happen.
Where Non-Revenue URLs Hide on Enterprise Domains
Why do enterprise sites accumulate so many non-revenue URLs? Because programmatic rules create pages automatically, and nobody audits the output. ALM Corp’s enterprise crawl optimization framework notes that “large sites often treat crawl optimization and content strategy as different workstreams. They should not be.” When thousands of pages exist only because a programmatic rule created them years ago, crawl budget optimization requires pruning and merging those pages out of existence.
The most common hiding places break down into predictable categories:
Faceted navigation and filter combinations. An e-commerce site with 50 product attributes and 10 values each can generate millions of filter URL combinations. Each combination looks like a valid page to Googlebot, but users almost never land on “red + size-medium + cotton + v-neck + under-500” via organic search. The case study data showing 45% of Googlebot requests going to parameter URLs came from exactly this type of exponential URL generation.
Internal search result pages. These are often crawlable by default, creating a near-infinite URL space tied to whatever terms users type into the on-site search bar. Google’s documentation on blocking indexing with noindex provides the technical mechanism (meta robots noindex tag or X-Robots-Tag HTTP header), but the organizational step of identifying and blocking these pages rarely happens without a deliberate audit.
Expired campaigns and seasonal content. Enterprise marketing teams launch promotional landing pages for campaigns, sales events, and seasonal pushes. When the campaign ends, the page stays live. After 3 years, a site carries hundreds of zombie campaign pages that Googlebot dutifully re-crawls every few weeks.
Staging and preview environments. As detailed in approaches to blocking non-production URLs from search indexing, staging URLs that leak into Google’s index must be removed from the index first before robots.txt blocking takes effect, because blocking crawl access prevents Google from seeing the noindex directive on the page.
The connection between site architecture breakdowns and organic revenue loss is well documented. Forbes’ organic search visibility fell by an estimated 60–80% over 2024–2025, concentrated in its diversified subdirectory structure. While Forbes’ situation involved content quality signals alongside structural ones, the underlying mechanism shares a common thread: when a domain’s crawlable surface expands beyond what its quality signals can support, organic performance across the entire domain degrades.
How Robots.txt and Sitemaps Work as Opposing Forces
Better Robots.txt’s crawl budget explainer describes the relationship with useful precision: “Robots.txt subtracts low-value pages from the crawlable surface. The sitemap adds high-value pages to the discovery queue.” These two files operate as complementary filters, and enterprise sites need both working in coordination.
The enterprise crawl budget audit should evaluate robots.txt for what it blocks and what it fails to block. A robots.txt file that hasn’t been updated since the site’s last redesign probably doesn’t account for URL patterns created by newer CMS features, plugin updates, or marketing automation tools. If your enterprise SEO architecture has evolved over the past 2–3 years but your robots.txt hasn’t, you’re almost certainly leaking crawl budget to URL patterns that didn’t exist when the file was last written.
Sitemaps need the same scrutiny. A sitemap that includes every URL on the site defeats its purpose. Enterprise sitemaps should be segmented by content type (products, categories, editorial, support) so that Google Search Console reporting reveals indexation rates per section. When a section’s sitemap contains 50,000 URLs but only 12,000 are indexed, that gap signals either quality problems or crawl budget competition from non-revenue URLs elsewhere on the domain.
Tip: Keep parameter patterns predictable and auditable. ALM Corp’s framework recommends this middle-ground approach as more effective than either extreme of indexing everything or blocking everything. The prioritization matrix gives you a defensible structure for making those calls template by template.
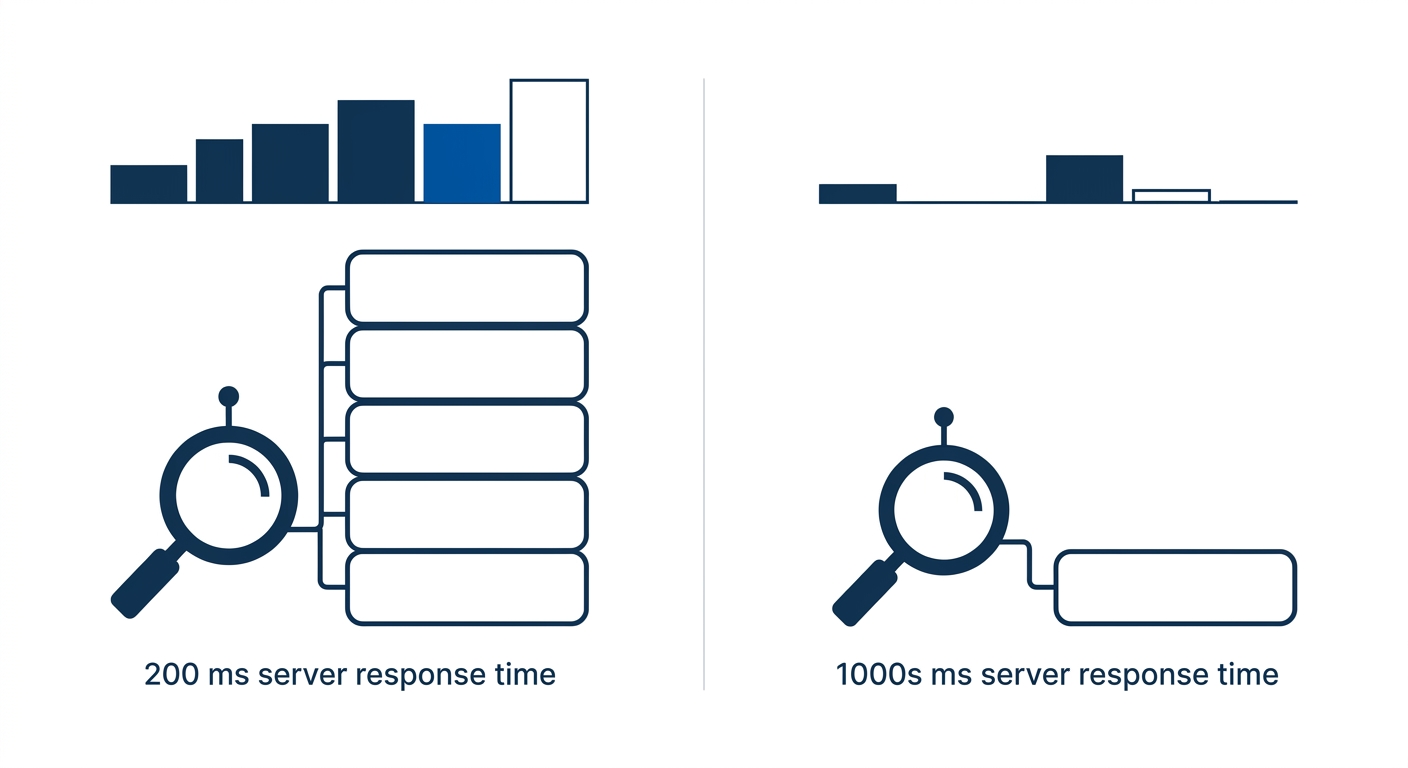
Server Response Time as a Crawl Budget Multiplier
Infrastructure decisions have a direct, quantifiable effect on crawl capacity. At a 200-millisecond server response time, Googlebot processes roughly 5 times more pages per crawl session than at a 1-second response time. For an enterprise site trying to get 80,000 product pages crawled regularly, the difference between 200ms and 1,000ms response times determines whether Google reaches those pages weekly or monthly.
This is where the technical audit connects to business outcomes. If you’ve pruned non-revenue URLs and optimized robots.txt but your server response time sits at 800ms, you’ve removed the waste without increasing the throughput. Both sides of the equation matter, and teams evaluating enterprise digital marketing services should expect crawl budget audits to address infrastructure performance alongside URL-level decisions.
The SEO debugging pyramid places crawl and render issues at the foundation, below content and link signals, precisely because no amount of content optimization matters if Google can’t efficiently access the pages.
Measuring Recovery After Non-Revenue URL Blocking
The audit is only useful if you measure what happens after implementation. Three metrics carry the most diagnostic weight:
- Crawl stats in Google Search Console. Track total crawl requests per day and their distribution across URL types. After blocking non-revenue URL patterns, total requests may initially drop (fewer pages to crawl), then stabilize as Googlebot reallocates attention to remaining pages. The key metric is crawl frequency on revenue-driving pages, which should increase within 4–8 weeks.
- Indexation coverage by sitemap segment. Segmented sitemaps let Google Search Console’s index coverage report show whether more of your product or category pages are reaching the index. An increase in “Valid” pages in revenue-driving sitemaps, without a corresponding increase in submitted URLs, indicates that crawl budget reallocation is working.
- Organic sessions and conversions on retained pages. The definitive measure. Sites implementing strategies to eliminate non-revenue URL waste from their crawlable surface should see organic session growth concentrated on the pages that remained. When high-volume content publishing degrades enterprise performance, pruning is the corrective action, and session data on surviving pages confirms the correction worked.
Recovery timelines vary by site size and crawl frequency. Expect 4–8 weeks for measurable shifts in crawl distribution, and 2–3 months before organic session changes stabilize enough to attribute confidently. Teams working with conversion rate optimization specialists can layer CRO analysis on top of the traffic recovery data to understand whether the recovered organic sessions are converting at expected rates, or whether the pages themselves need UX attention to capture the additional volume.
Questions the Numbers Still Can’t Answer
Crawl log data tells you where Googlebot went and how long it spent there. It doesn’t tell you why Google assigned the crawl priority it did, or precisely how much indexation delay a specific non-revenue URL pattern caused. Google’s crawl budget documentation acknowledges that allocation factors in “elements that are relevant to the specific Google product,” but the weighting of those elements remains opaque.
The prioritization matrix gives you a defensible framework for deciding what to block and what to protect, but the revenue contribution axis relies on your own analytics data, which carries its own measurement gaps. Pages with zero organic sessions may still serve a user journey role (size guides, warranty information, FAQ content) that supports conversion on other pages. Cutting them without understanding their indirect contribution can backfire, sometimes significantly.
And the timeline question persists. Google doesn’t publish how quickly it reallocates crawl budget after a site removes large URL blocks. The 4–8 week window referenced above comes from observed patterns, not from any confirmed algorithm specification. Sites with stronger overall quality signals and faster server response times tend to see faster reallocation, but the exact relationship between domain authority, response time, and crawl budget redistribution speed remains empirical rather than documented.
The strongest enterprise crawl budget audits pair quantitative crawl data with qualitative business context. The matrix provides the structure. Your team’s knowledge of which pages actually matter to customers provides the judgment calls the data alone can’t make. Getting both right is what separates an audit that recovers organic visibility from one that just produces a spreadsheet.