The SEO Debugging Pyramid: Building a Monitoring Stack That Catches Visibility Drops Before They Cost Revenue
Across five documented root causes of organic traffic loss, attribution changes inside Google Search Console account for an entire category that most marketing teams never investigate. According to SEO Clarity’s traffic loss analysis framework, traffic previously counted as organic can shift between reporting categories without any actual change in user behavior. Visits from Google Business Profile, for example, may have been reported as organic search sessions for months before being reclassified. The chart goes down. Revenue stays flat. And the team spends three weeks in organic traffic debugging mode, chasing a problem that doesn’t exist.
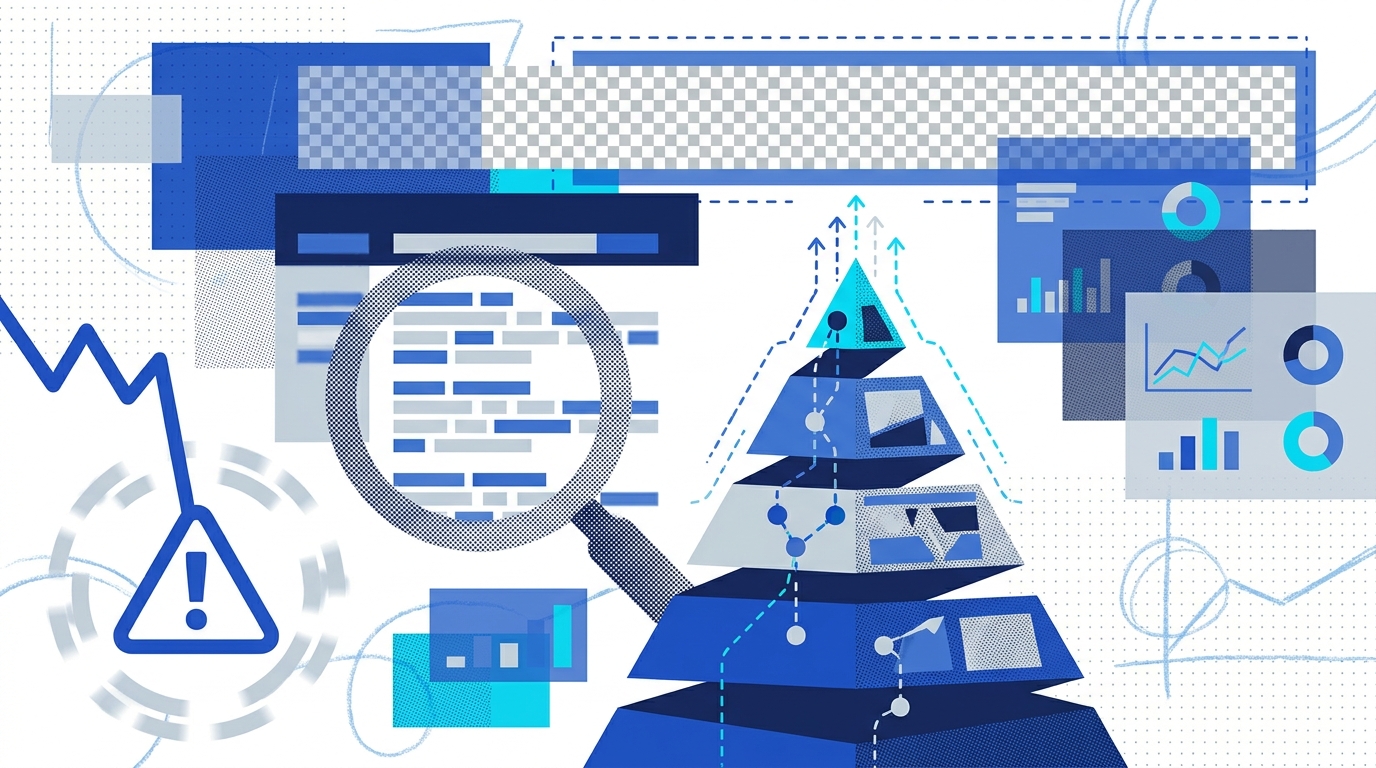
This is exactly the kind of false signal that a structured SEO monitoring framework is designed to filter out. The concept of the “debugging pyramid” gives marketing leaders a layered system for catching real visibility problems early, and for telling real problems apart from measurement noise.
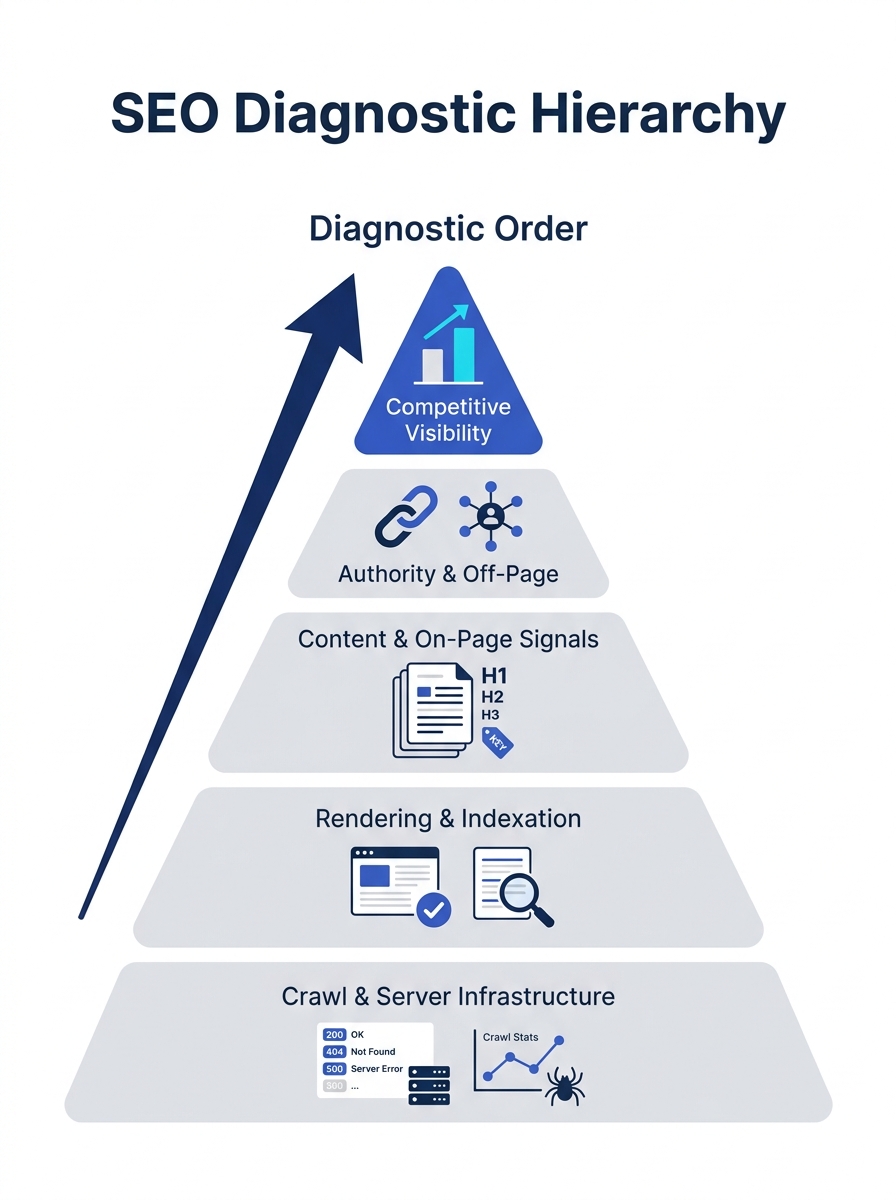
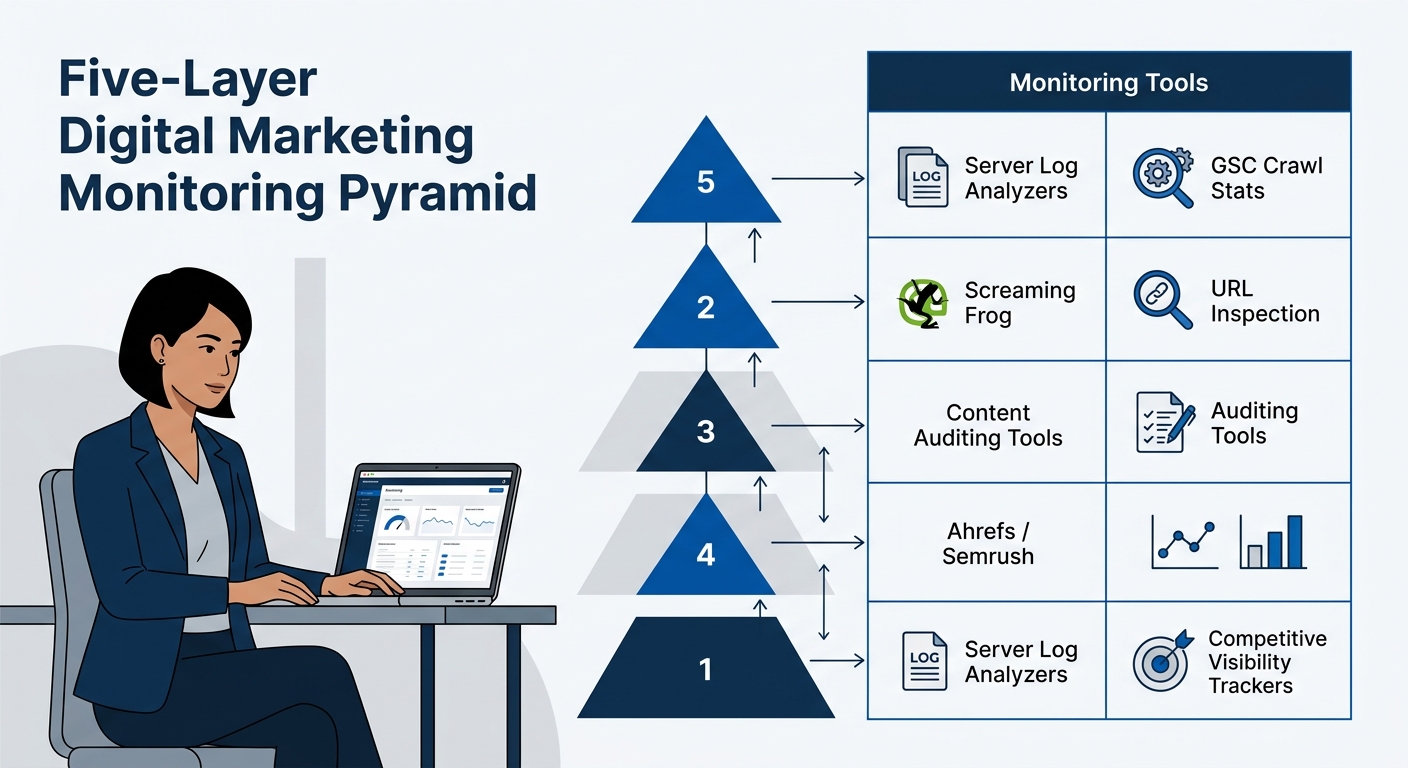
The Pyramid Has Five Layers, and Order Matters
Search Engine Land’s practical framework for debugging visibility issues identifies the foundational metrics that any monitoring stack should track: crawl budget utilization, server response times, JavaScript rendering success rates, indexation ratios, and organic visibility trends. These aren’t random metrics thrown onto a dashboard. They’re arranged in a diagnostic hierarchy where each layer depends on the one below it.
Think of it like triage. If Googlebot can’t reach a page (Layer 1: crawl and server infrastructure), then checking whether that page ranks for your target keyword (Layer 4: ranking signals) is a waste of everyone’s time. The pyramid forces a team to work from the bottom up.
Here’s how the layers stack:
- Crawl and server infrastructure — Can search engines reach your pages at all?
- Rendering and indexation — Once reached, do pages render correctly and enter the index?
- Content and on-page signals — Is the indexed content aligned with search intent?
- Authority and off-page signals — Do external signals support the page’s credibility?
- Competitive visibility — Where do you stand relative to the sites that rank alongside you?
Each layer has its own set of tools, its own alert thresholds, and its own failure modes. When your agency presents a technical SEO diagnostics report, you should be able to see which layer of the pyramid each finding belongs to. If you can’t, the report is organized around tools rather than problems, and that’s a red flag.
Infrastructure: Where Most Undetected Problems Live
The bottom of the pyramid is crawl budget and server health. These are the metrics that, when they go wrong, produce the most delayed and confusing symptoms.
Crawl budget optimization matters most for large sites. If you’re running an e-commerce catalog with tens of thousands of product pages, or a publishing site that generates new URLs daily, Googlebot has to make choices about what it crawls and how often. Seobility’s crawl budget guide documents how dynamic JavaScript content requires more crawl budget for indexing than static HTML, because the rendering step is expensive. Search Engine Journal confirms this from another angle: if Googlebot spends fewer resources rendering each page, it can crawl more pages in the same window.
What this means for a marketing leader reviewing an agency’s monitoring setup: ask whether they’re tracking crawl stats from server logs, not only from Google Search Console. GSC tells you what Google reported. Server logs tell you what actually happened. The two don’t always agree, and log-level crawl data catches problems days before GSC surfaces them.
Server response times above 500 milliseconds during Googlebot’s crawl window are a warning sign. Response codes in the 5xx range during peak crawl hours can waste your entire crawl allocation for the day. If your agency isn’t monitoring server logs with attention to bot-specific traffic, you’re flying without instruments at the layer where failures are hardest to see and most expensive to recover from.
This ties directly into how Core Web Vitals affect Philippine e-commerce sites, because slow server response times cascade into LCP failures that hurt both crawl efficiency and user experience simultaneously.
Rendering and Indexation: The JavaScript Blind Spot
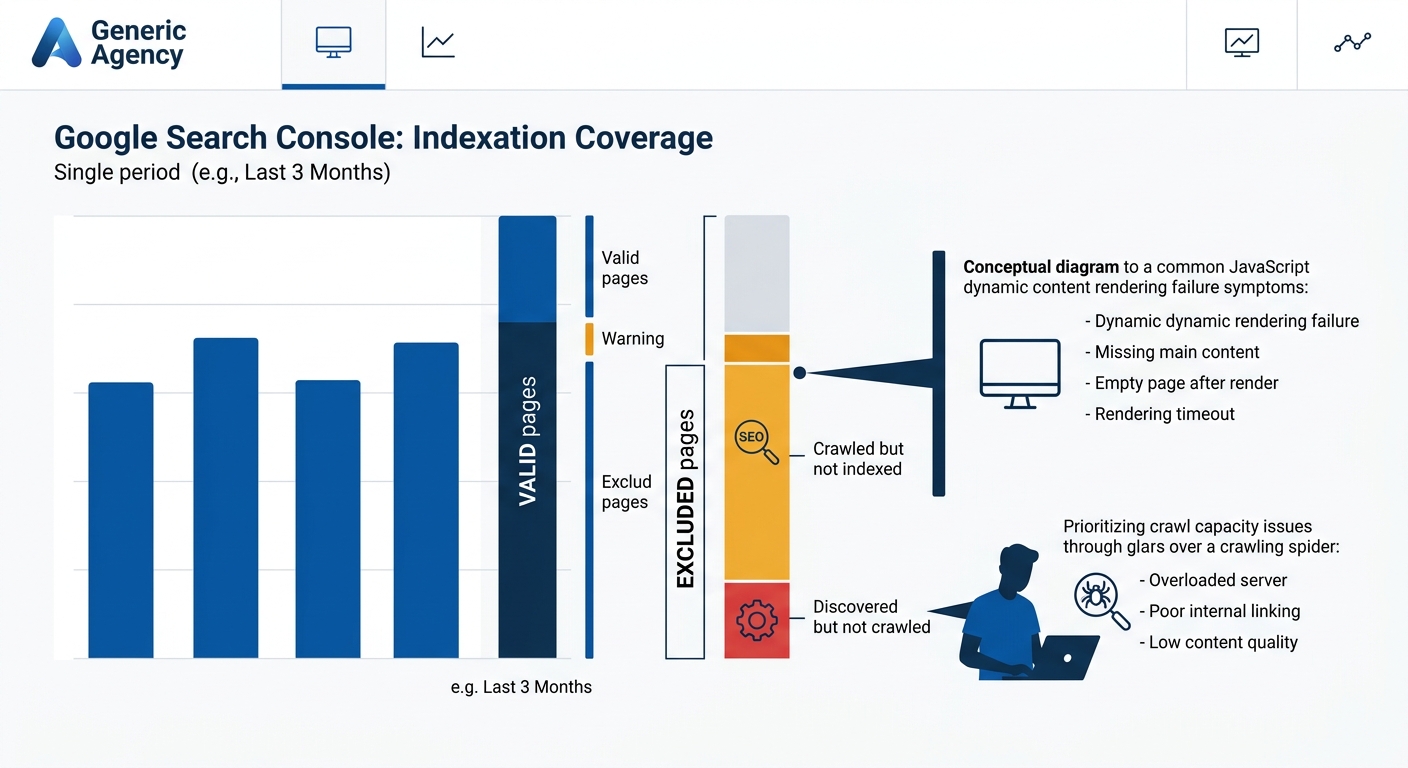
Layer two is where JavaScript rendering issues cause the most damage for modern websites. The gap between what a human sees in a browser and what Googlebot indexes after rendering is one of the most underdiagnosed categories in technical SEO diagnostics.
Here’s the practical scenario. Your development team ships a new product listing template built on a JavaScript framework. The page looks perfect in Chrome. But Googlebot’s rendering queue processes that page hours or days after the initial crawl. If the JavaScript fails to execute in Google’s renderer, the page enters the index with little or no meaningful content. Your rankings disappear for those URLs, and nobody connects the drop to the template change because the deployment happened two weeks ago.
Warning: A single template change on a JavaScript-heavy site can affect hundreds or thousands of pages at once. Tools like SEO Radar and ContentKing monitor for template-level SEO element changes in near real-time, which is critical for catching these problems before they cascade into traffic loss.
The indexation ratio is the simplest diagnostic number at this layer: how many of your submitted URLs actually appear in Google’s index? If you’ve submitted 10,000 pages via sitemap and only 6,000 are indexed, the 4,000-page gap deserves investigation. That gap could be crawl budget exhaustion, rendering failures, thin content signals, or intentional exclusion via noindex tags that were applied by accident.
Brands evaluating their agency’s technical SEO audit methodology should ask specifically how rendering verification is handled. Screaming Frog’s JavaScript rendering mode and Google’s URL Inspection Tool provide ground truth, but someone has to actually run them against a representative sample of page templates after every significant deployment.
The Diagnostic Workflow When Traffic Actually Drops
When organic traffic does drop, the pyramid provides a triage protocol. But before you even start climbing the layers, you need to run what AOK Marketing calls the data sanity checklist.
The first question is segmentation. Is the drop isolated to one country, one device type, or one subdirectory? If yes, stop looking for a sitewide cause. A 20% traffic decline that’s entirely concentrated in mobile visits to your blog directory is a fundamentally different problem than a 20% decline spread evenly across your whole domain.
The second question is brand versus non-brand. Branded queries typically behave independently of algorithm changes. If brand search traffic is stable but non-brand collapsed, you’re probably looking at a ranking signal issue (Layer 3 or 4) or a competitive shift (Layer 5). If brand traffic dropped too, something more fundamental changed, and you should be investigating whether Google can even access and render your pages properly.
The third question is the one most teams skip: check conversions. If sessions are down but conversions are flat or even up, the business impact is materially different from what the traffic chart suggests. You may have lost low-intent informational traffic while retaining high-intent commercial visits.
A 20% traffic decline concentrated in one device type within one directory is a fundamentally different problem than a 20% decline spread across your domain. Segment before you diagnose.
This workflow connects to the broader challenge of building SEO dashboards that predict revenue impact rather than displaying vanity traffic numbers. The pyramid isn’t useful if the team panics at every fluctuation in a line graph. It’s useful when the team knows which fluctuations actually matter.
Assembling the Monitoring Stack in Practice
A complete monitoring stack doesn’t require a dozen tools, but it does require deliberate coverage of each pyramid layer. Google Search Console remains the foundation because it provides indexation data, crawl stats, and performance metrics directly from Google. Coupler.io’s technical SEO dashboard template demonstrates how GSC data can be pulled into a centralized view that tracks indexation status and crawl anomalies alongside performance trends.
Screaming Frog or Sitebulb covers the rendering verification layer, with scheduled crawls that compare JavaScript-rendered output against raw HTML. Semrush or Ahrefs adds the competitive intelligence layer, so you know whether your visibility decline is absolute (something broke on your site) or relative (a competitor gained ground). DebugBear, as documented in their 2026 monitoring tools comparison, handles Core Web Vitals regression detection with continuous field data collection.
The missing piece in most stacks is change detection. UptimeRobot’s analysis of SEO change detection tools highlights how CMS updates, plugin changes, and routine development work cause more SEO regressions than deliberate strategic decisions do. A tool like ContentKing or SEO Radar that continuously crawls your site and alerts you when meta tags, canonical URLs, or robots directives change is the difference between catching a problem in hours versus discovering it in weeks.
For brands working with an agency, the question to ask isn’t “which tools do you use?” but rather “which pyramid layer does each tool cover, and what’s the alert threshold for each?” If the agency can’t map their tooling to a diagnostic hierarchy, their monitoring is reactive by design. They’ll find problems after your traffic drops. A layered SEO monitoring framework finds problems while they’re still invisible in the traffic data.
What the Numbers Still Can’t Answer
The pyramid framework, for all its structure, has a significant blind spot: it assumes the problem is technical. The data can tell you that your indexation ratio dropped, that your crawl budget is being wasted on parameter URLs, or that JavaScript rendering issues are preventing content from reaching the index. It can tell you which layer broke and approximately when.
What it can’t tell you is whether the content Google does successfully index is actually worth indexing. The most perfectly crawled, rendered, and indexed page still loses rankings if the content doesn’t match what searchers need. And with the shift toward AI-generated search results documented in Google’s AI Mode rollout, even the meaning of “visibility” is changing underneath us. A page can rank, appear in the index, pass every technical diagnostic, and still lose clicks because an AI overview answered the query before the user ever saw a blue link.
The monitoring stack catches infrastructure failures and measurement artifacts. It surfaces the mechanical reasons traffic changes. The strategic question of whether your content deserves the traffic it’s getting (or losing) requires human judgment applied to the data, and that judgment is what separates a dashboard from a diagnosis.